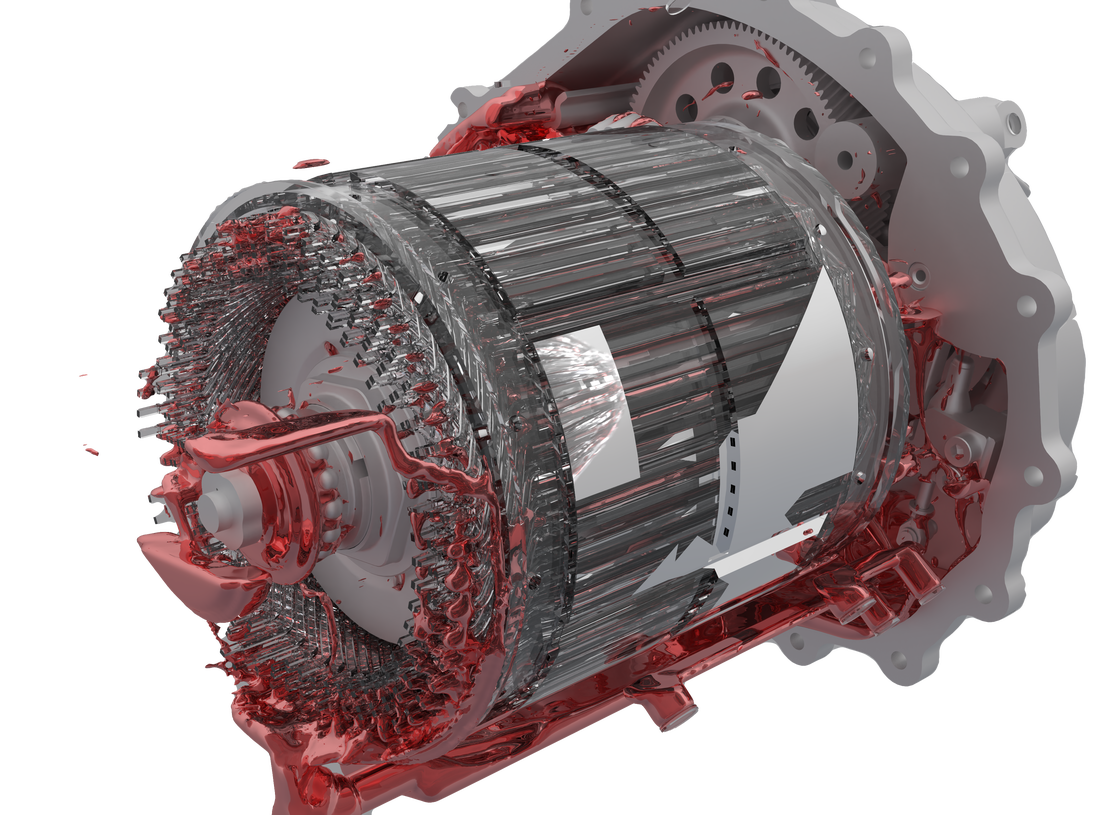

电力驱动单元(EDU)在现代电动汽车中处于核心地位,它们将电机构和传动系统结合到一个紧凑的单体系统中。 这些单元对于实现电动汽车的效率、性能和可靠性至关重要。
设计EDU的一个关键挑战是确保有效的润滑。 适当的润滑可以减少摩擦、降低组件磨损并帮助散热,所有这些都是保持系统长寿命和高效性的关键。 此外,由于 EDU 以高速和变化的负载运行,优化润滑对于实现峰值性能并满足严格的耐久性要求至关重要。
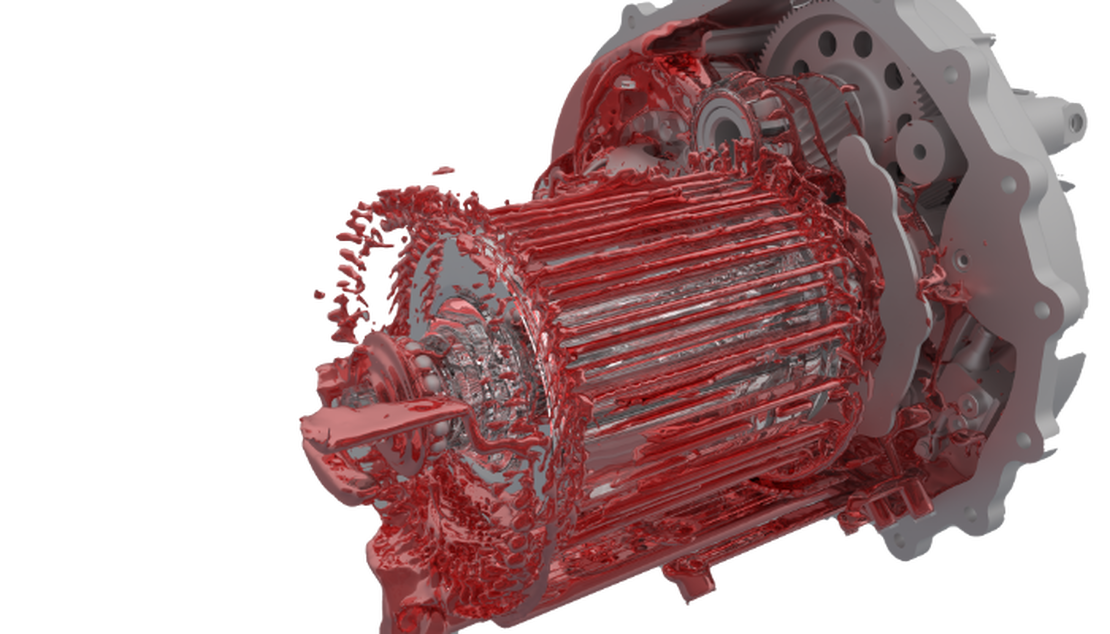
该模拟案例探讨了 EDU 内的润滑行为,重点关注油如何分布以及如何与关键部件相互作用。
第三部分的目标:检查传输中的关键区域
第二部分(/case-studies/edu_part2/)重点介绍了电动机,而第三部分则将重点转移到 变速箱 上。 这部分与我们网站上的齿轮箱箱体 (使用 shonDy 进行齿轮箱润滑 和 使用 shonDy 进行低温齿轮箱润滑) 有相似之处。 因此,这里的目标也是类似的:确保轴承的有效润滑,并实现整个传动系统中润滑剂的最佳分布。 适当的润滑可减少摩擦和磨损,有助于提高 EDU 的整体效率和使用寿命。
案例说明
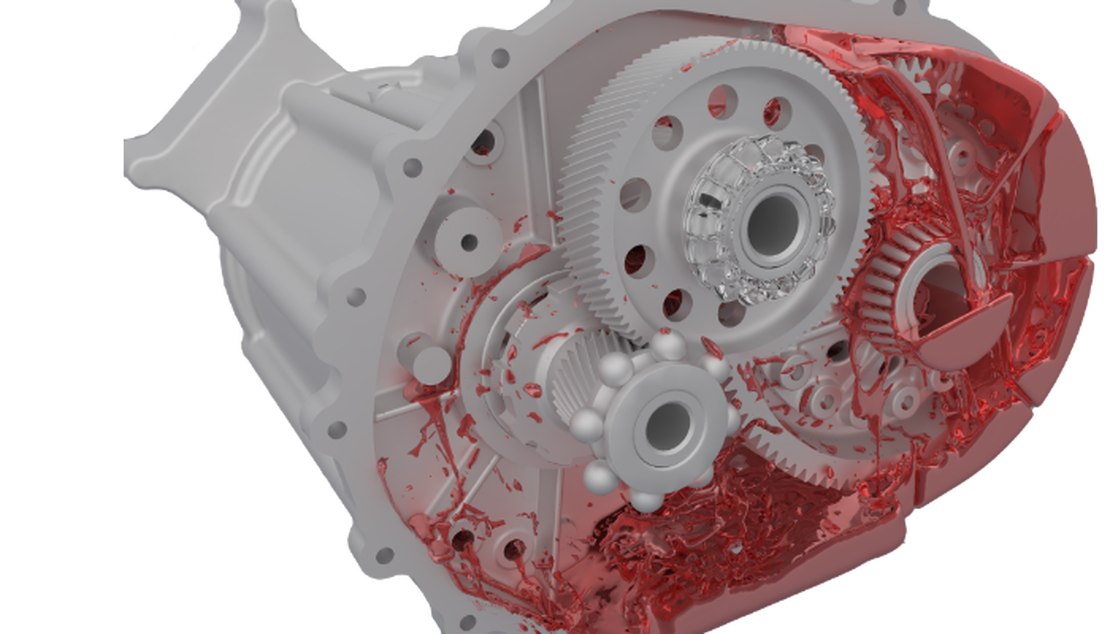
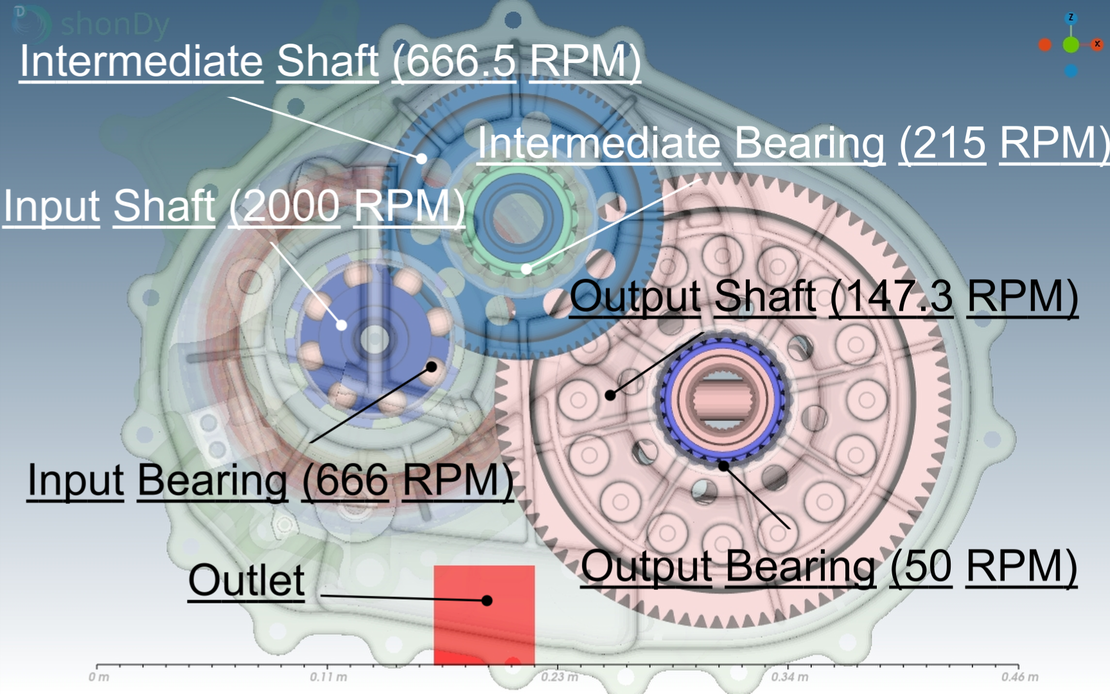
下图显示了变速箱的一般设置。 为避免重复,本节只介绍变速箱设置。 有关电动机配置的详细信息,请参阅 第二部分。
各轴和轴承的转速如下:
| 组件 | 转速 | 组件 | 转速 |
|---|---|---|---|
| 输入轴 | 2000 转/分钟 | 输入轴承 | 666 转/分钟 |
| 中间轴 | 666.5 转/分钟 | 中间轴承 | 215 转/分钟 |
| 输出轴 | 147.3 转/分钟 | 输出轴承 | 50 转/分钟 |
模拟开始时油底壳中大约有 1.6 升油。 模拟采用了 0.064 毫米的颗粒粒径,颗粒总数约为 500 万。 图中的红色框表示位于变速箱油底壳中的出口。 该出口与 第二部分 的转子入口相连。 出口以 12 升/分钟的速度抽取油,然后重新分配到转子入口。
监控通过位于轴承周围的采样窗口进行。 下图突出显示了位于变速箱一侧的采样点。
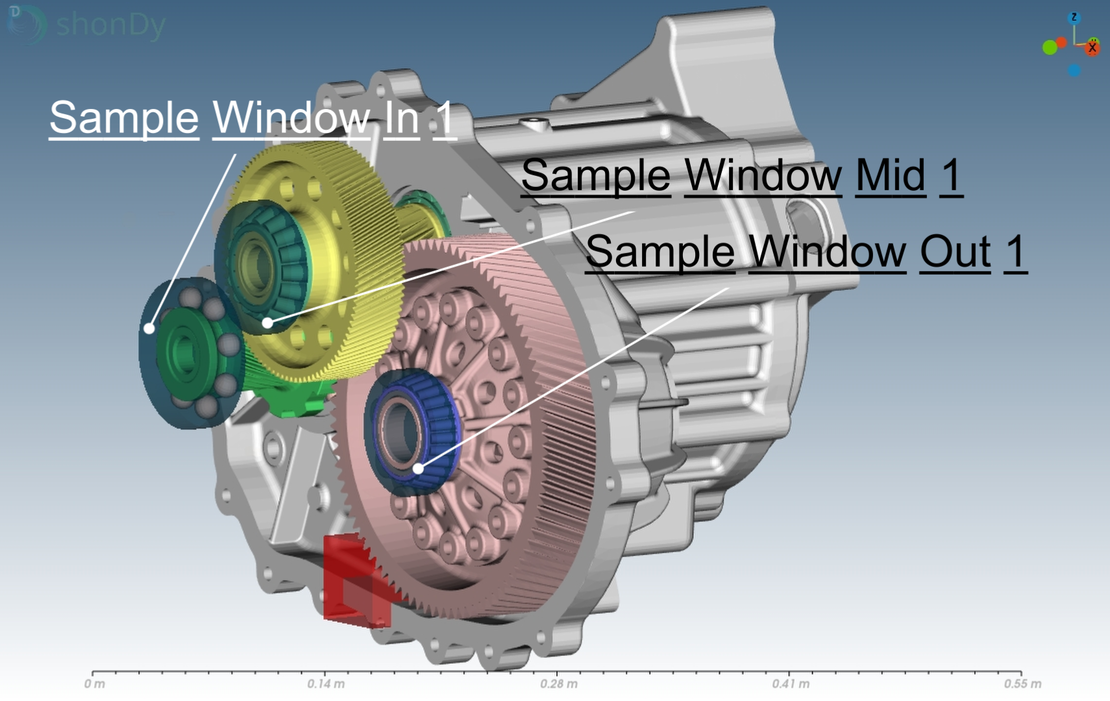
- 如上图所示,标有数字 1 的样本代表位于变速箱 前部 的样本。
- 标有数字 2 的采样点位于变速箱 后部(此图中不可见)。
仿真结果
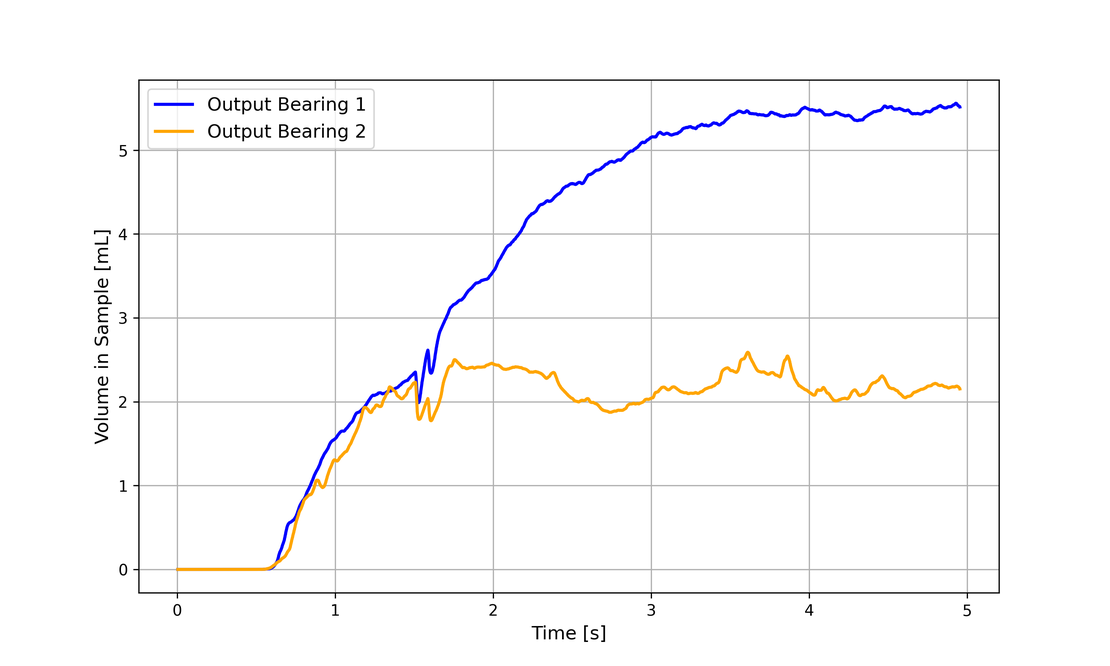
在下图中,同一轴上两个采样点(1和2)的数据被显示在同一图表中。 通过比较,我们可以清楚地看到每根轴前后的润滑情况。
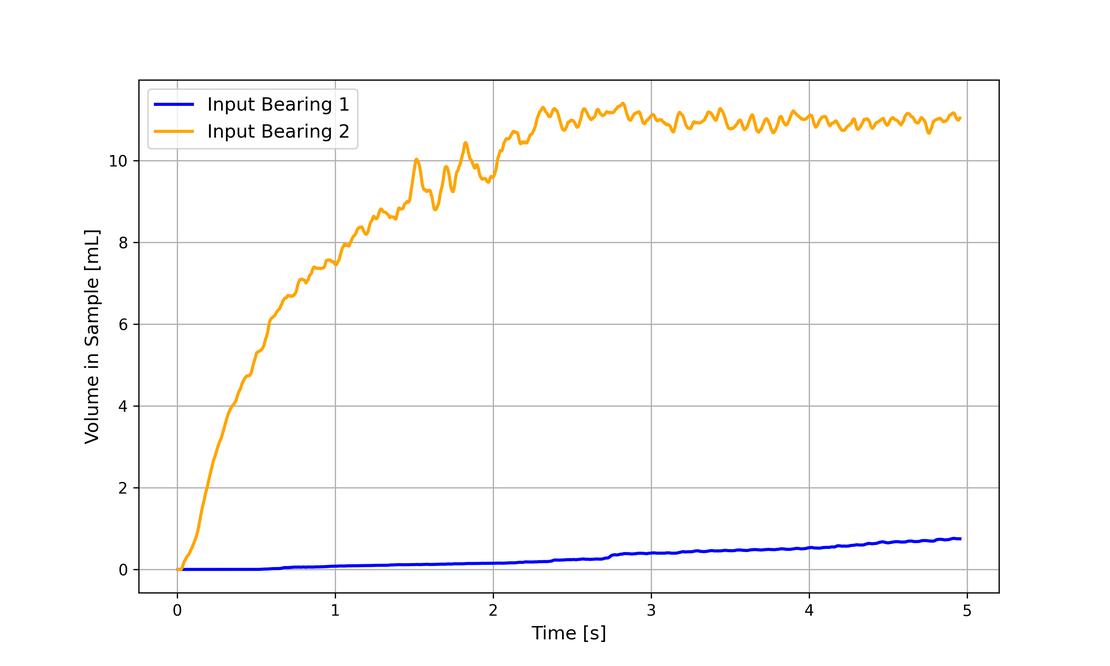
输入轴
关键观察结果:
- 轴承 2(后部)比 轴承 1(前部)获得的润滑剂要多得多。
- 轴承2 在大约3秒的仿真时间后达到稳态,润滑剂体积稳定在约11毫升。
- 轴承 1 在5秒的仿真时间内未达到稳态:
- 在仿真的前半段,轴承1几乎未获得任何润滑剂。
- 在仿真的后半段,情况略有改善,但轴承1仍然只接收到极少量润滑剂。
- 仿真结束时,采样点内的润滑剂总量不足1毫升。
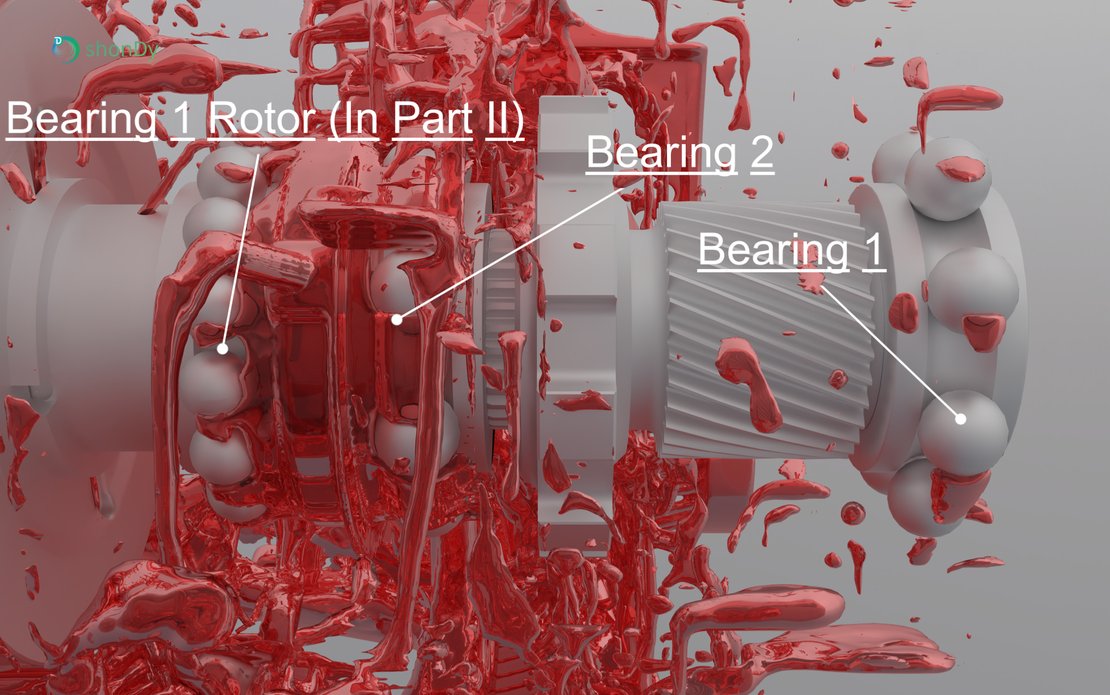
下图直观地显示了润滑剂的分布情况。
- ** 轴承 2** 已完全润滑,轴承滚珠之间可见液体。
- 相比之下,轴承 1 只有几滴润滑油,表明覆盖面不足。
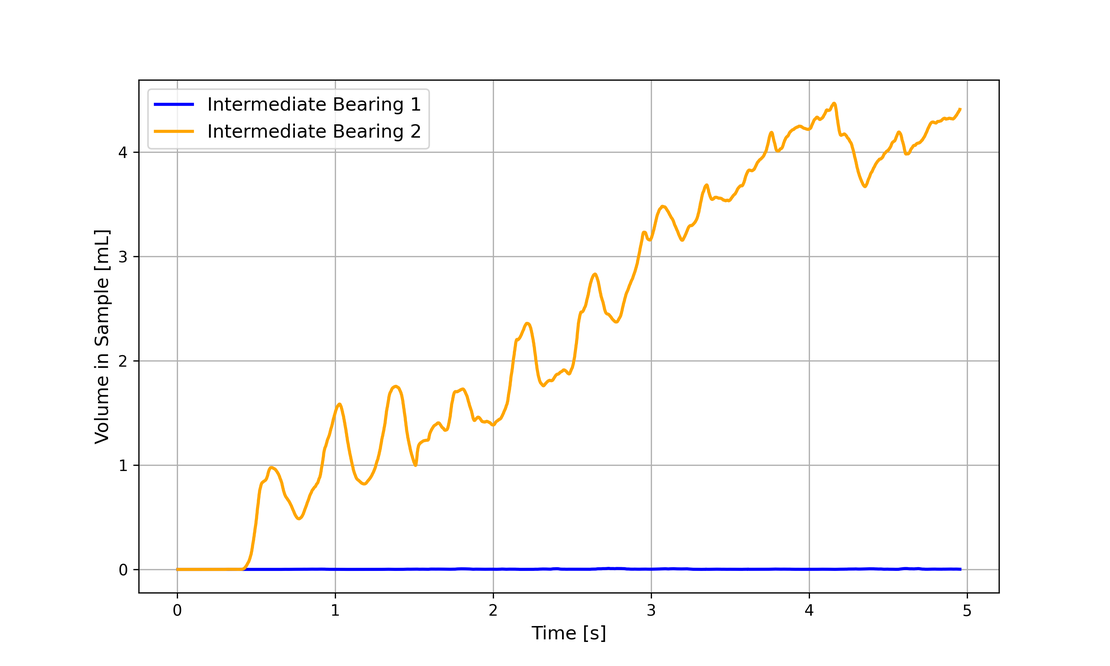
中间轴
关键观察结果:
- 与输入轴类似,轴承 2 得到的润滑油明显多于轴承 1。
- 轴承1在整个仿真过程中没有得到任何润滑剂,凸显了关键的润滑缺口。
- 仿真结束时,轴承2采样点内的润滑剂体积约为4毫升,少于输入轴的轴承1中观察到的体积。
- 轴承2 在仿真接近结束时似乎趋于稳态,但需要延长仿真时间才能确认这一点。
下图显示了中间轴轴承中的润滑剂分布情况:
- ** 轴承 2** 得到充分润滑,轴承的每个滚珠之间都能看到液体。
- 而 ** 轴承 1** 则显示轴承内没有可见的润滑剂。
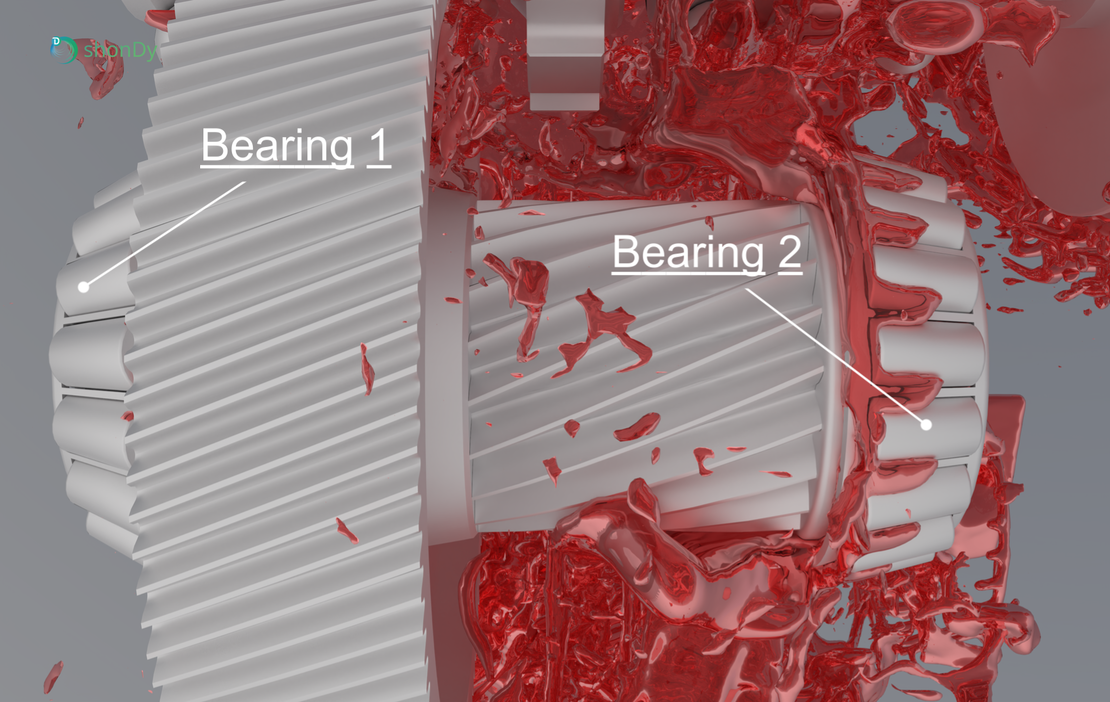
输出轴
两个轴承均达到了稳态,轴承1在3.5秒后稳定,轴承2在2秒后稳定。
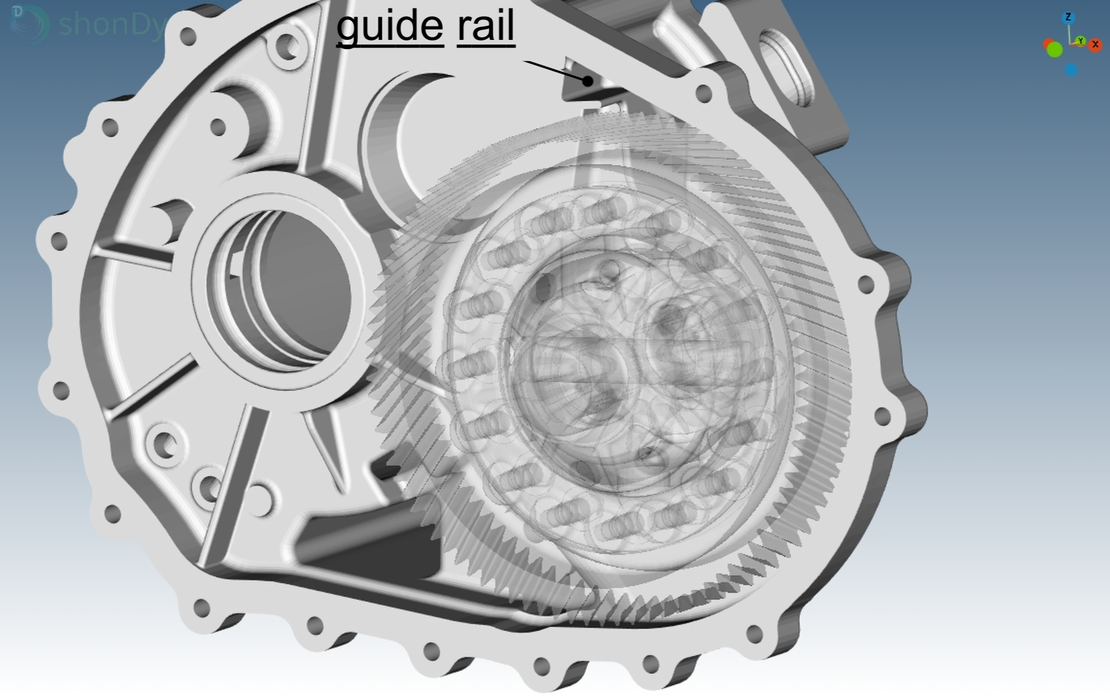
轴承1稳定在6毫升,而轴承2稳定在2毫升。 这使得输出轴与其他轴不同,因为它是唯一一个前端轴承比后端轴承接收更多润滑剂的轴。 此外,输出轴是唯一一个附近壳体配备了导轨的轴,导轨将润滑剂从齿轮引导至轴承。
左图显示了壳体的一部分以及输出轴,其中导轨清晰可见。 输出齿轮将润滑剂带到壳体顶部,然后将其抛到导轨上,导轨将润滑剂横向分配到轴承上。
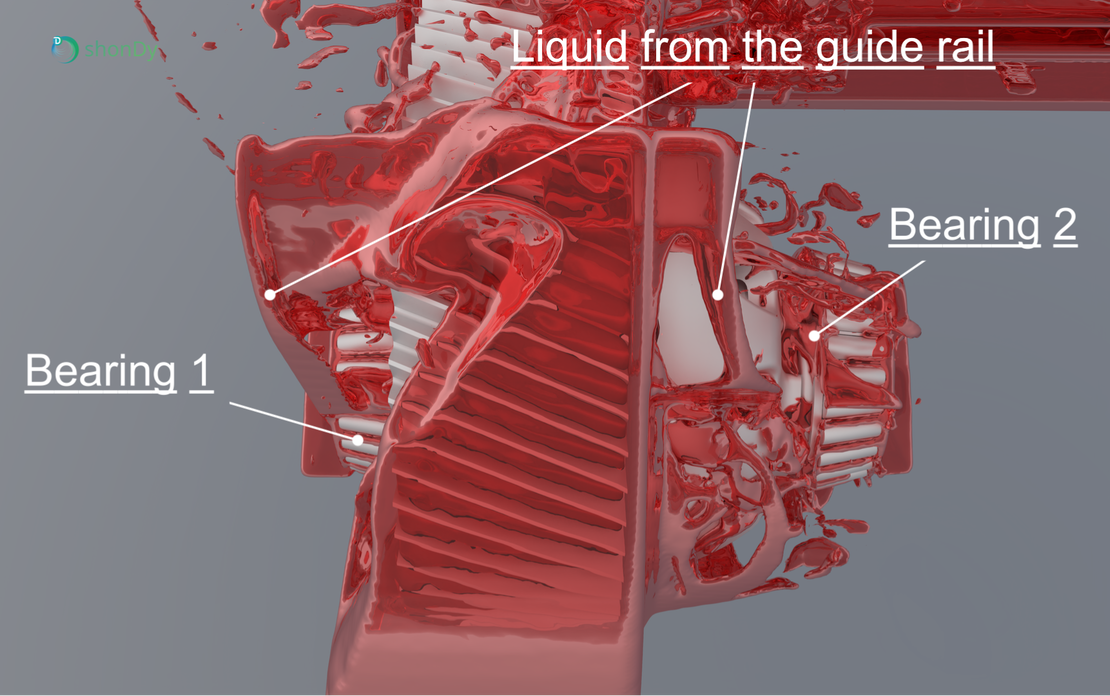
第二张图展示了这一过程,其中壳体被隐藏,仅显示齿轮和轴承。 轴承2比轴承1接收更少润滑剂的原因也显而易见:
- 对于 ** 轴承 1**,流体直接导向轴承。
- 对于 ** 轴承 2**,流体在到达轴承之前首先在差速器外壳上流动。
尽管如此,两个轴承的滚珠之间都充满了润滑剂,确保了适当的润滑。
总结
This simulation examines lubricant distribution in the transmission of an Electric Drive Unit (EDU), revealing imbalances across the input, intermediate, and output shafts.
- 输入轴:轴承 2 在 11 毫升时达到稳定状态,而轴承 1 始终润滑不足(<1 毫升)。 这种不平衡凸显了一个潜在的设计问题,需要进一步优化。
- 中间轴:类似的问题出现在中间轴,轴承2 接收到4毫升润滑剂,而轴承1 完全未润滑,表明存在润滑缺口。
- 输出轴:与其他轴不同,轴承1(6毫升)比轴承2(2毫升)接收到更多润滑剂,这是由于导轨将油液从齿轮引导至轴承。
这些结果强调了进一步优化的必要性,以确保润滑平衡,从而提高EDU的效率和耐久性。 可能的优化措施包括增加导轨或采用主动润滑系统。