
Coastal storms and floods can send sudden surges of water across roads, parking areas, and evacuation routes in low-lying shoreline communities. Rising water can lift cars from the ground long before depths appear life-threatening. Under normal circumstances, vehicles are not designed to float. Their weight distribution, engine placement, and body structure typically cause them to sink or become unstable in deep water.
These dynamics have prompted growing interest from automotive manufacturers in developing vehicles with controlled floating capabilities for emergency evacuation scenarios. Understanding how propulsion from the normal wheels can perform in water, when they lose ground contact, and how body design affects stability during floating becomes critical. Engineers need reliable simulation tools to predict vehicle behavior in flood conditions, assessing buoyancy forces and evaluating drive system effectiveness in semi-submerged states.
案例描述
The simulated scenario investigates the floating behavior of a sealed car and its propulsion in water with the following drive modes: rear wheel drive (RWD) and all-wheel drive (AWD). For comparison, a scenario without wheel movement was also investigated.
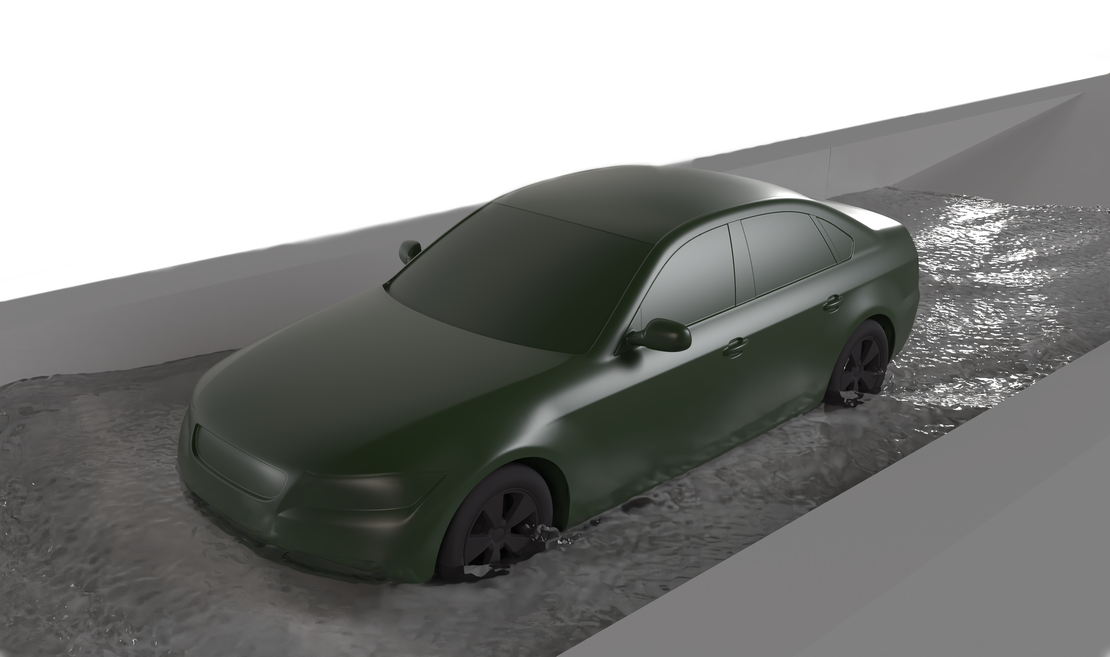
At the start of the simulation, the car stands on the floor of an open-top container, which is connected to a podium with a ramp.
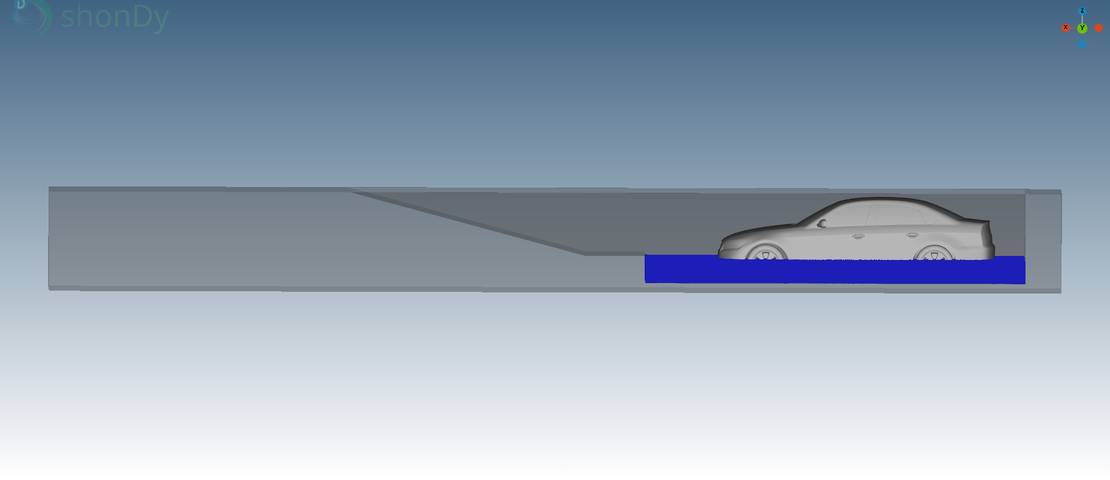
The initial water level in the container is 0.4 m. The box is then flooded for 4.4 seconds until the water level reaches 1 m, which causes the car to float. After that, the car moves according to the respective drive modes. The car’s wheel velocity is set to 21 m/s, which leads to a turning velocity of the wheels of 65.63 rad/s.
In this setup, the fluid particle radius was set to 7.4 mm, resulting in a total of 1.5 million particles before and 5.25 million particles after flooding the container.
Results & Analysis
Buoyancy and floating dynamics
In the following video, the water level in the container starts rising which eventually causes the car to float.
In order for a car to float on water, the mass of water displaced by the car needs to exceed the car’s own mass. Both masses can be calculated using this formula:
with ρ being the average density of the car and the displaced water, respectively, and V being the respective volume.
As the water level rises, the volume of water displaced by the car rises as well, increasing the mass of the total displaced water until it exceeds the mass of the car. This causes the car to float.
In order to be able to make quantitative statements about the floating conditions, the water level in the container and the center of mass of the car are plotted in a diagram over time.
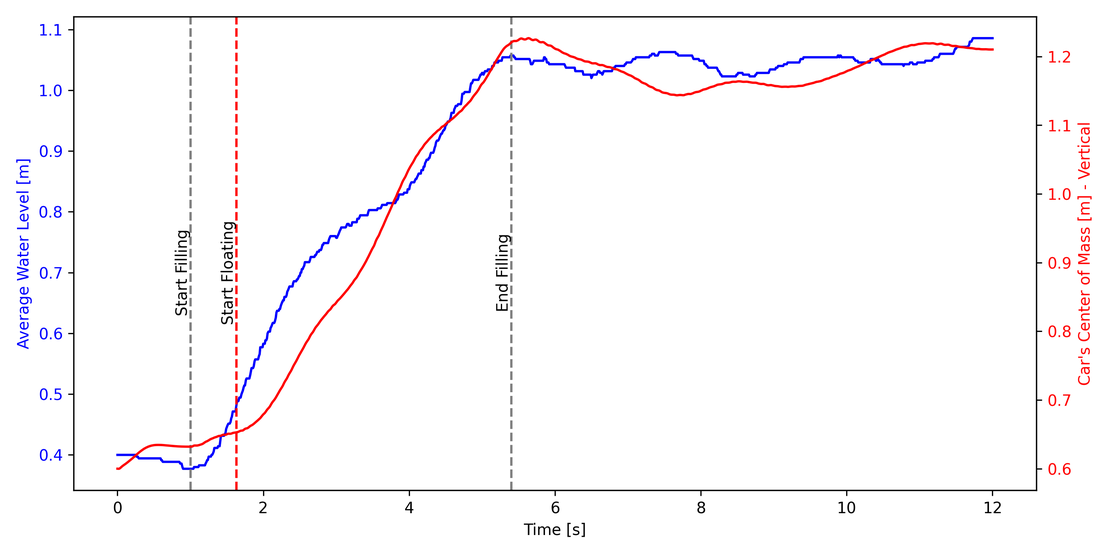
In this diagram, the dynamics of the filling and floating process can be analyzed in detail. The start and end of the filling process are marked at 1 s and 5.4 s, respectively. In between these two points, the water level rises.
The start of floating is also marked at 1.63 s and a water level of 0.48 m, providing crucial information about the floating conditions.
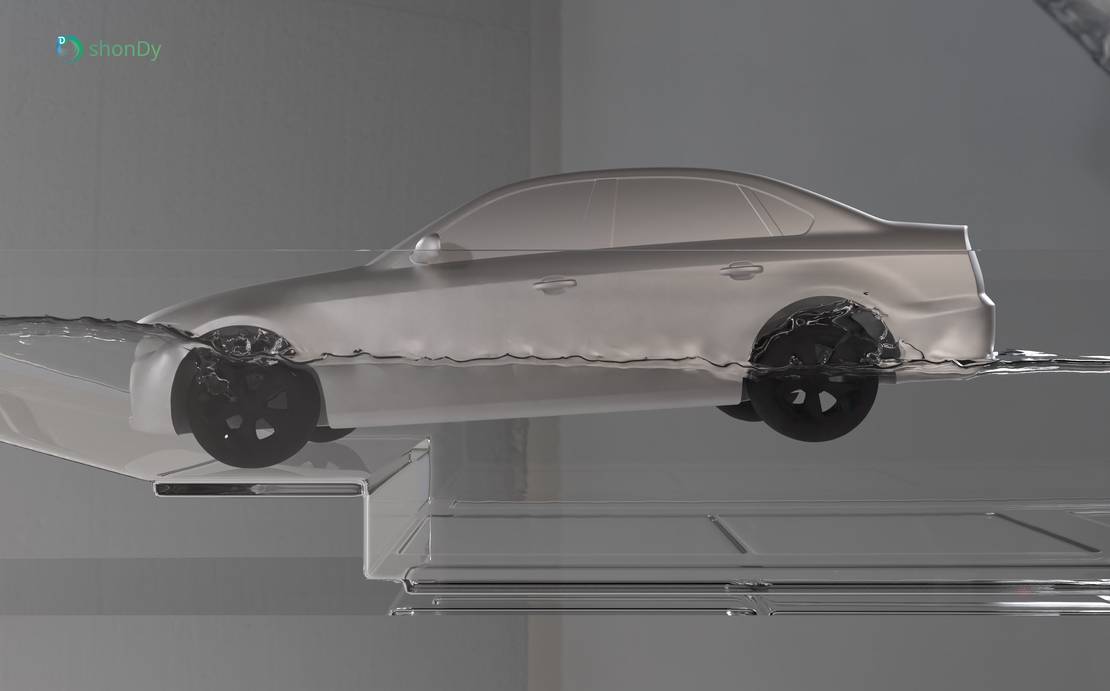
Propulsion behavior: No motion vs. RWD vs. AWD
The next videos show the propulsion of the car in water with the different drive modes. Without wheel movement, the car drifts along with the current at low speeds without directed motion. In contrast, the car with RWD moves forward at a significantly faster speed. This confirms that the wheel movement influences the movement of the car in a floating scenario.
With RWD, the car touches the ramp and is repelled because the forward-directed force from the wheels is not strong enough to push it up the ramp and out of the water.
The car with AWD is propelled forward at an even faster speed compared to the car with RWD until it comes in contact with the ramp. As soon as the front wheels touch the ramp, the traction between the two solids causes the car to accelerate, driving it out of the water and up the ramp.
The following graph shows the velocity of the car and the angular velocity of the respective wheels over time for the three drive modes.
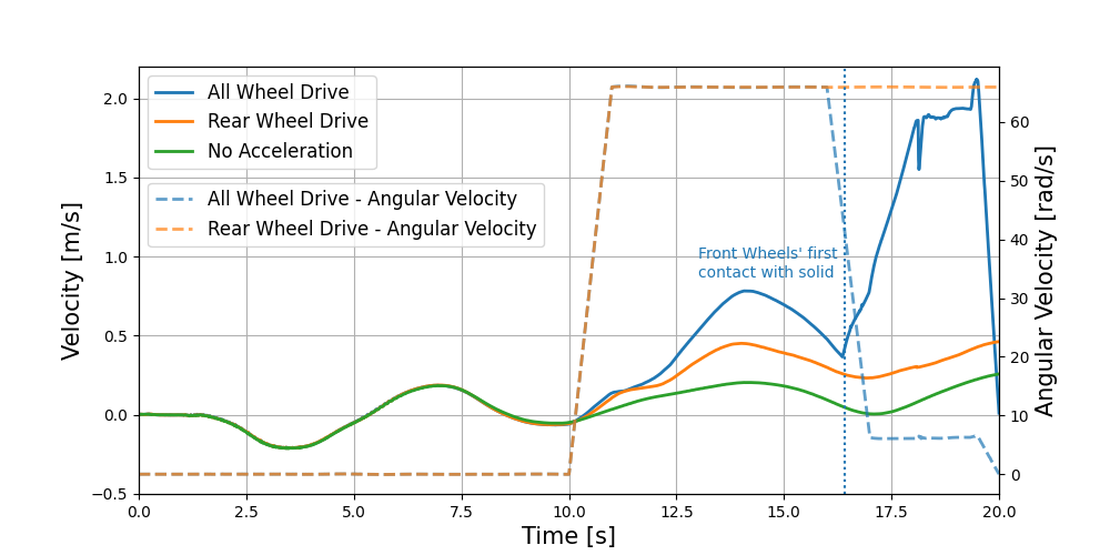
After 10 seconds, the angular velocity of the AWD and RWD cars increases sharply to 65.63 rad/s, which leads to an increase in velocity for both cars. The velocity of the AWD car rises at its peak to about 2 times the maximum velocity of the RWD car.
After about 16 s, the front wheels of the AWD car touch the solid ramp which is indicated with a black vertical line. The contact between the moving front wheels and the ramp leads to a sudden increase in velocity, and the angular velocity is decreased actively; otherwise, the acceleration would be too high.
The velocity of the RWD car fluctuates around a constant value. This indicates that the car has not yet touched the solid ramp. Touching the ramp would lead to a sharp decrease in velocity due to repulsion.
All three velocity curves show a peak after about 14 seconds. This can be explained by the encounter of the impulse wave caused by the forward motion of the cars, which is reflected at the ramp.
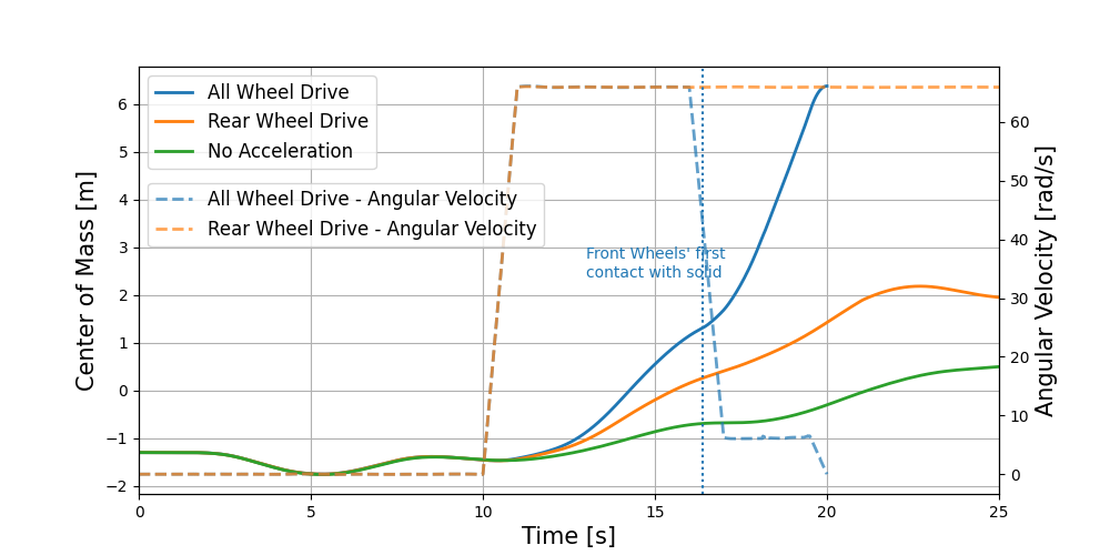
The next diagram shows the center of mass of the cars and the angular velocity over time. The center of mass provides insight into the position of the cars. It shows that the car with AWD reaches the end of the pool much faster than the RWD and can leave the water. The AWD simulation ends after 20 seconds when reaching the top of the ramp.
The RWD car can propel itself through the pool and, in contrast to the car with no wheel movement, reaches the end of the pool but cannot leave it.