
齿轮润滑对于保持齿轮系统的效率和耐用性至关重要,它可以减少摩擦、散热以及防止磨损和腐蚀。 适当的润滑可确保平稳运行,延长零部件的使用寿命,并提高系统的可靠性。
在低温条件下,润滑变得更加重要。 寒冷条件可能会导致润滑剂变稠,降低了它们流动及保护齿轮表面的能力。 这可能导致摩擦增加、磨损以及启动问题。 专用低温润滑剂旨在保持流动性和有效性,即使在寒冷环境中也能确保一致的保护和平稳运行。
在这种情况下,目的是将模拟结果与实验结果进行比较。
在这种情况下,我们的目标是将模拟结果与实验结果进行比较,重点关注不同温度下的润滑情况。 基础案例](/case-studies/gear_box/) 已在前面介绍过。 详细信息和一般案例设置可以在那里阅读。
主要区别在于不同温度下的粘度变化,影响润滑剂性能 我们将比较两个高转速的情况和实验数据。
通过分析这些案例,我们旨在评估润滑油在不同温度条件下的行为,并验证仿真结果与真实世界性能的一致性。 这项比较将提供不同温度范围内润滑剂效能的洞察,并有助于优化齿轮系统设计,以提升其可靠性和效率。
案例设置
如前所述,该案例使用的几何形状与 基础案例 相同,因此这里只提及与基础案例的不同之处。 这两种流体属性分别用于代表润滑剂在 25°C 和 -40°C 的情况。
| 参数 | 案例 1 (25°C) | 案例 2 (-40°C) | ||||
|---|---|---|---|---|---|---|
| 输入速度 | 1543 RPM | 1543 RPM | ||||
| 液体体积 | 400 毫升 | 400 毫升 | ||||
| 密度流体 | 809.4 kg/m3 | 840.5 kg/m3 | ||||
| 运动粘度 | 3.356E-5 m2/s | 3.247E-3 m2/s | ||||
| 表面张力 | 0.021 N/m | 0.021 N/m | 重力 | 9.81 m/s2 | 9.81 m/s2 | |
| 结束时间 | 9 秒 | 15 秒 |
仿真结果
案例 1 : 25°C
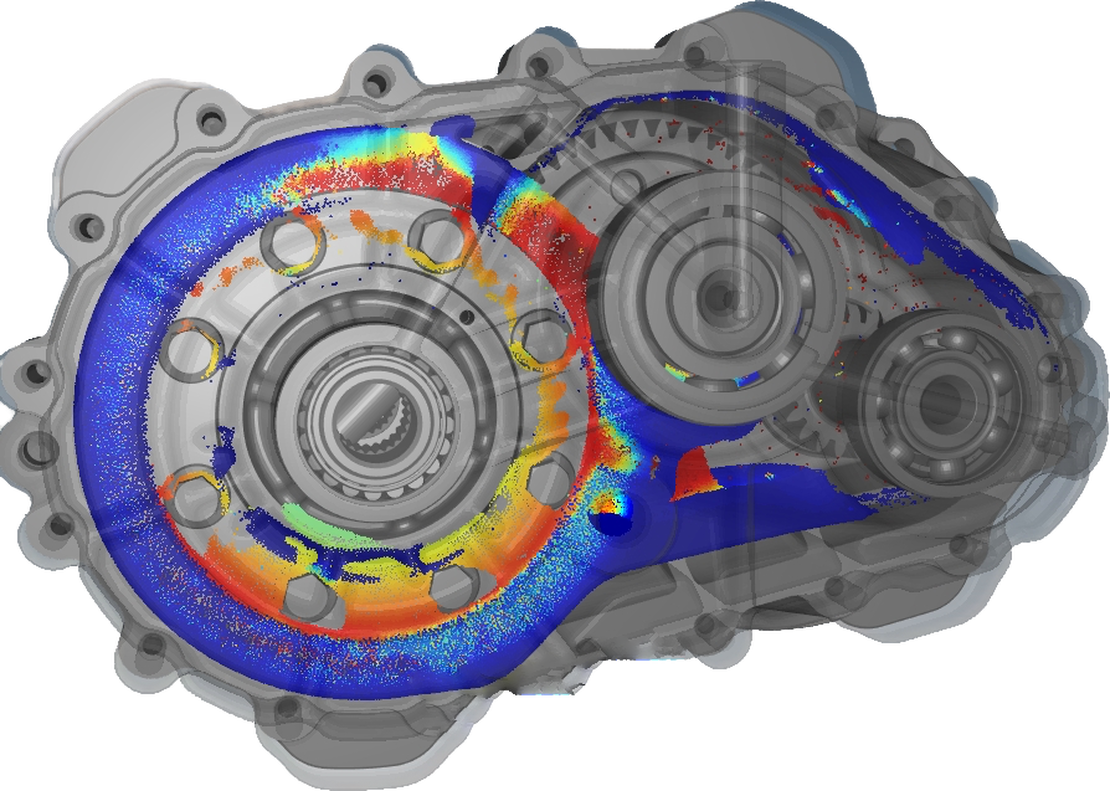
正面视图
从前视图中可以看出,所有三个轴承都通过通向它们的通道提供润滑剂:左侧轴承连续填充(红色圆圈),轴承前面的腔室与实验中类似填充。 中间方位角(绿色圆圈)也通过池中填充,但模拟似乎高估了实验结果,导致右侧方位角(黄色圆圈)在模拟中也比实验中填充得更多。 尽管如此,在这两种情况下,通道都被填充并为轴承供电。
俯视图
从这个角度来看,可以清楚地看到水池(绿色大圆圈)如何不断充满流体,从中向中间轴承提供通道(绿色小圆圈)。
侧视图
在侧视图中,壳体表面的润滑剂分布可以与实验结果进行比较。 可以看出,在模拟中,液体的扩散比在实验中要明显宽广。 在实验中,外壳的左半部分仅略微润湿,看不到清晰的红色;相反,必须仔细观察,表明流体膜比套管右侧薄得多。 这并未在模拟中反映出来。 然而,在比较案例1和案例2时,趋势是一致的:案例2中的湿润区域明显比案例1要窄,这一趋势在模拟中也能观察到。
轴承的体积流量
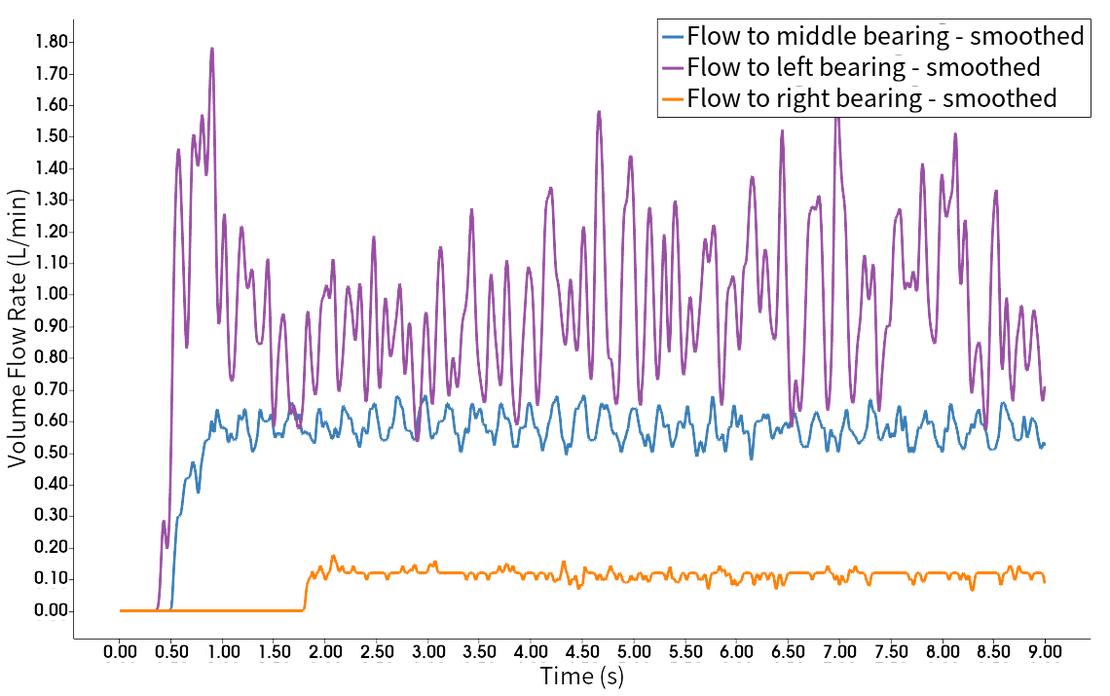
在图中,记录了各个轴承的体积流量随时间的变化。 可以看出,所有体积流量几乎都处于稳定状态,表明模拟已经运行了足够长的时间 左侧轴承的体积流动最为波动,波动范围大约在0.7至1.5升/分钟之间 – 这种脉动在实验中也能观察到。 第二高的体积流量是流向中间轴承的流量,为 0.6 L/min,其次是流向右侧轴承的体积流量,为 0.1 L/min。
案例 2: -40°C
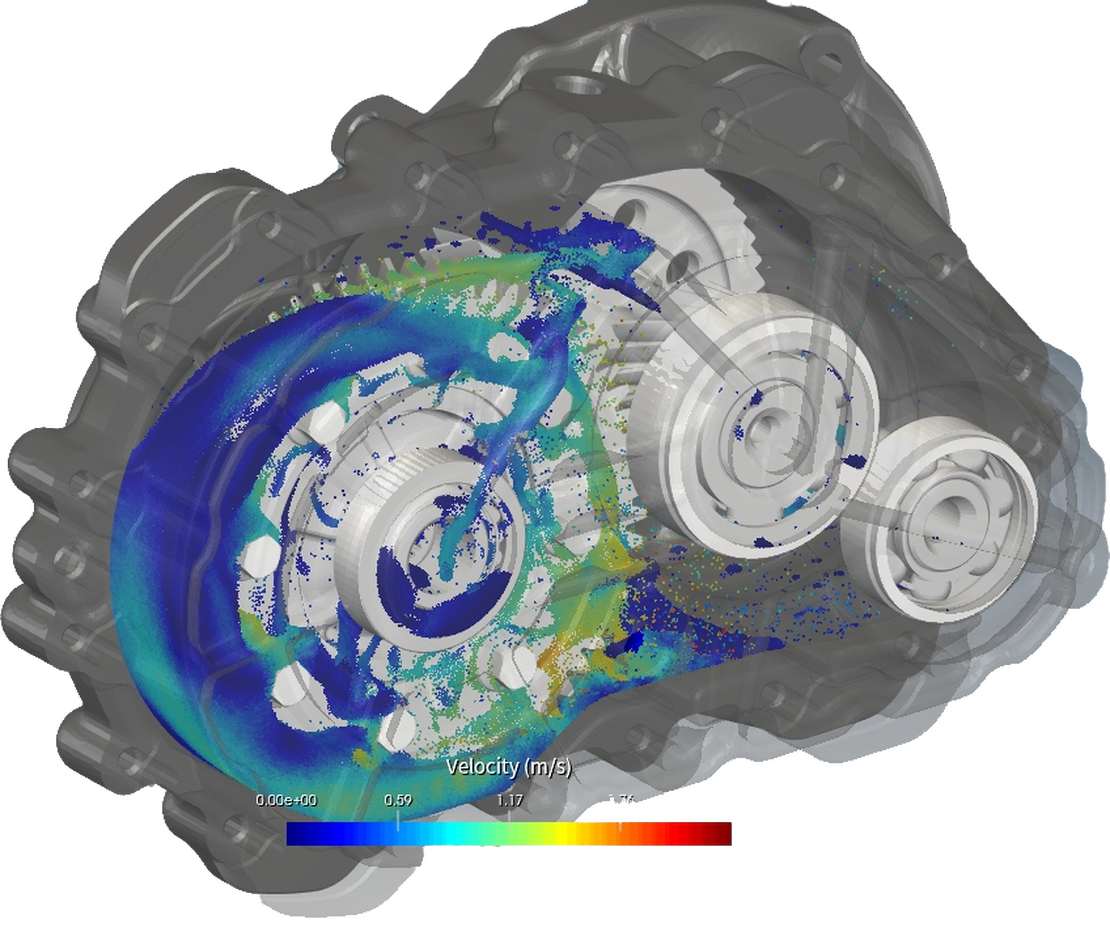
正面视图
在正面视图中,与案例1相比,液体的粘度显著增高。 在这种情况下,左方位(红色圆圈)也通过指定的通道填充,但如果查看时间戳,可以看出这比情况 1 中花费的时间要长得多。 由于粘度较高,前轴承室内积聚了更多的流体。 这一观察结果与实验是一致的。 然而,在实验中腔体内的流体分布略有不同:在模拟中,流体几乎是同心地扩散,而在实验中并未观察到这种情况。
在模拟中,可以观察到润滑剂在模拟的右侧区域(黄色圆圈)定期脱落。润滑剂从中间轴的齿轮上向上抛出,在短暂粘附到外壳之前掉落到输入轴上。 由于视频的质量,实验无法确认或否认这种周期性行为;人们只能看到润滑剂到达了这个齿轮箱的部分,但无法知道如何。
俯视图
在顶部视图中,可以观察到两件事情。 首先,实验与仿真均表明外壳上的小水池(绿色圆圈)并非持续充满。 在这两种情况下,少量润滑剂都会到达这个位置,但要达到填满通道(小绿圈)到中间轴承的程度还远远不够。
在此视图中的第二个观察是由于第二根轴(黄圈)导致的外壳润湿。 在这里,模拟和实验之间的流体分布也是一致的。
侧视图
从侧面视图中,也可以观察和比较润滑剂在外壳上的分布。 在这里也可以看出,润滑剂分布与实验非常相似:由于高粘度,液体没有扩散,仅在齿轮直接后方的壳体上形成润湿,不像在情况1中那样覆盖了相对较大的区域。
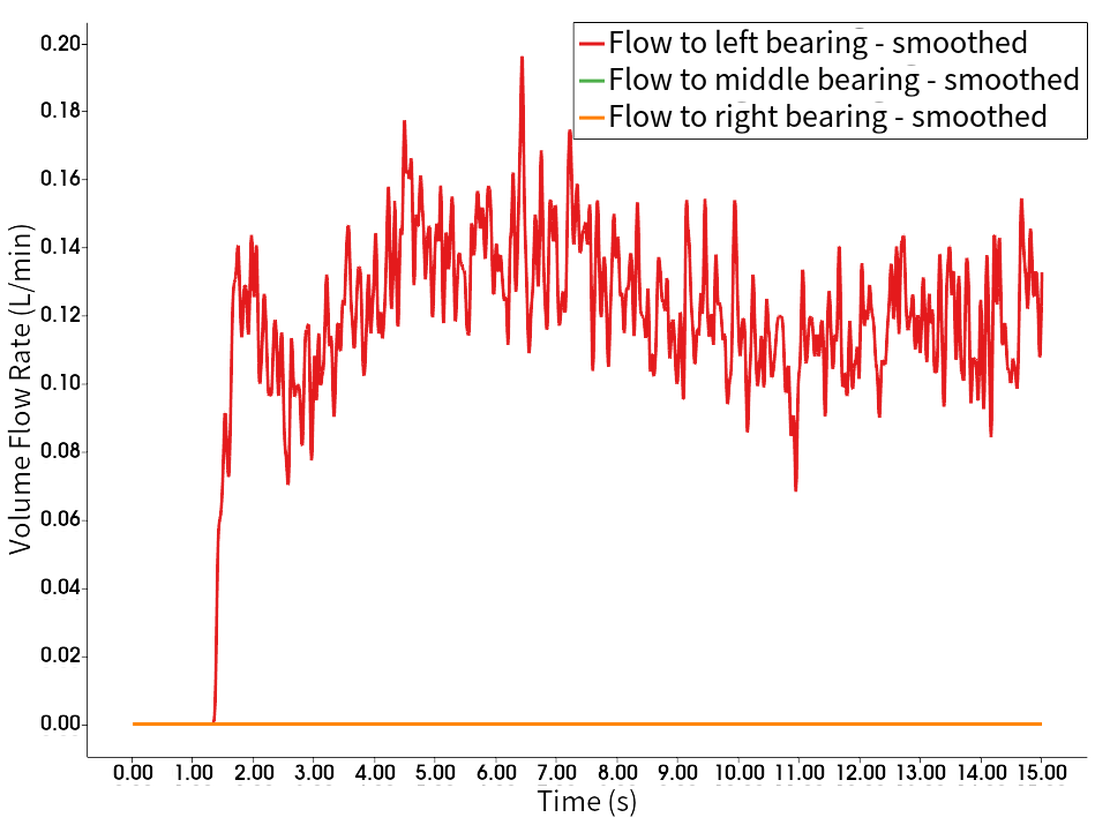
轴承的体积流量
从这个图表中可以看出,左侧轴承的体积流量平均略高于案例1,并且脉动较小,波动范围大约在0.1至0.16升/分钟之间。 正如先前观察到的,其余轴承的通道根本就没有供应。