这里,利用被称为诺伊曼问题的解析解来验证凝固。 The analytical solution to this solidification problem are used for example by Hu et al.[1] and Kawahara et al.[2].
实验描述
将最初为液态的板坯从一侧冷却至熔点以下。 可以获得温度分布和熔体前沿位置的解析解,以便与模拟数据进行比较。 接口位置可以从以下位置获得:
$x(t) =2Q \sqrt{\alpha t}~~~~~~~(1)$$
Q is obtained from a transcendental equation that depends on the material properties and results to 1.19 for the material properties used in this comparison. α是热扩散率,t是时间。 固相温度的解析解为
对于液相
$ T_l(x, t) = T_{inf} + (T_m - T_{inf}) * \frac{erfc(x / (2.0 * \sqrt{\alpha_l * t}))} {erfc(Q)}~~~~~~(3)$
热物理性质总结在表中。
| 参数 | 值 |
|---|---|
| 加热电压 | 400 W/(m*K) |
| 密度 | 1000.0 kg/m3 |
| 比热容 | 1000.0 J/(kg*K) |
| 潜热 | 200000.0 J/m3 |
| 右墙 | 173.15 K |
| 左墙 | 283.15 K |
| 初始熔点 | 283.15 K |
模拟设置描述
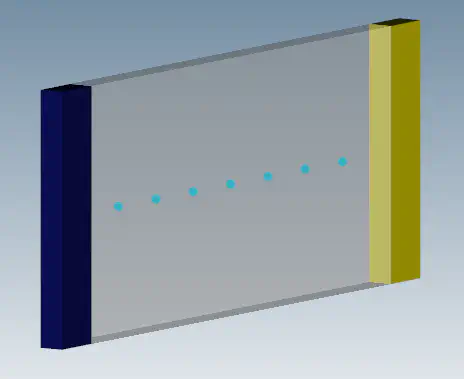
A simulation is setup with one particle region for the melt and two polygonal regions for the left and right wall. 粒子半径设置为0.000713米,忽略重力的影响。 下图显示了初始粒子区域的几何设置。 温度样本沿 x 轴放置,以便与分析结果进行比较 The initial temperature of the liquid is set to 283.15 K. The right wall is set to a constant temperature of 173.15 K. This wall is used to cool down the initial liquid below its solidification point. The left wall is set to the same temperature as the initial fluid temperature.
模拟结果与实验的比较
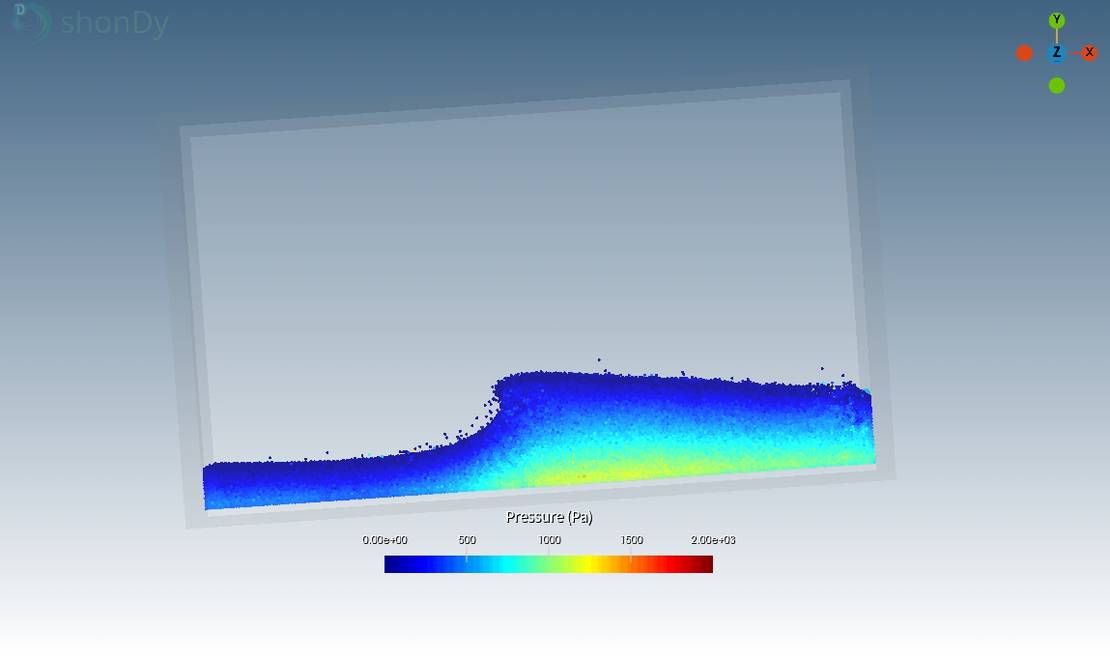
时间点t=4s时温度分布的模拟结果如下图所示 左壁和右壁保持恒定的初始温度。 The liquid is being cooled down from right to left.
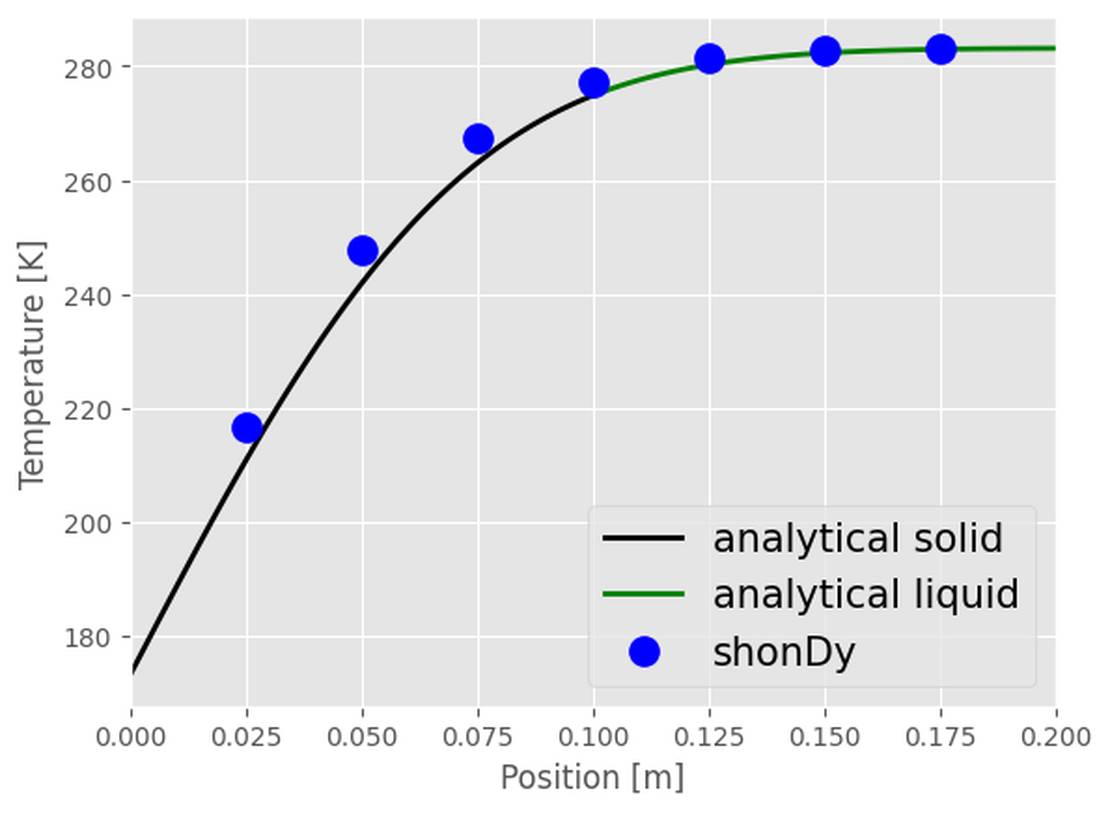
该图显示了时间 t = 4 s 时的分析结果和模拟结果的比较。 在左图中,黑线表示固体温度的分析结果(见公式 (2)),而绿线表示液相的温度分布(见公式3) 在左图中,黑线表示固体温度的分析结果(见公式 (2)),而绿线表示液相的温度分布(见公式 总体而言,分析结果和模拟结果具有很好的一致性。
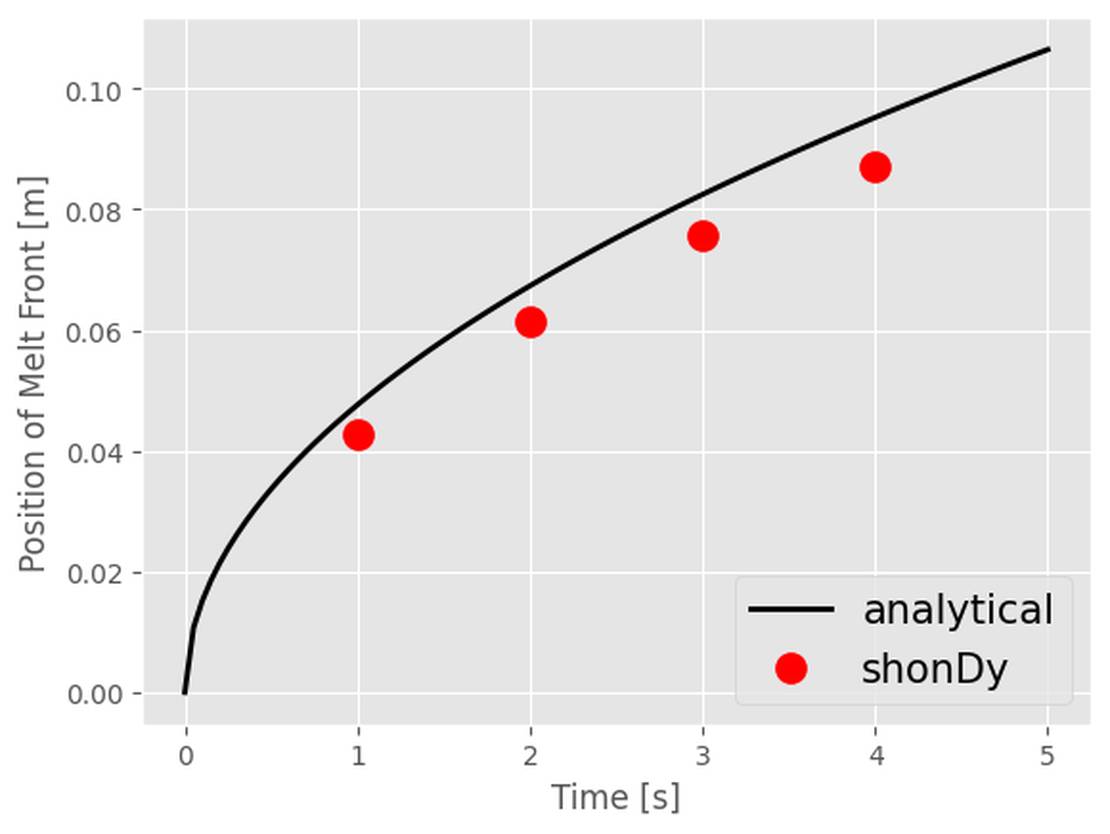
右图比较了熔体前沿的进展 使用公式(1)计算分析结果(黑线),而红点表示模拟结果。
[1] H. Hu 和 S. A. Argyropoulos, “Mathematical modelling of solidification and melting: a review”, Modelling and Simulation in Materials Science and Engineering, vol. 4, no. 4, p. 371, 1996.
[2] T. Kawahara and Y. Oka, “Ex-vessel molten core solidification behavior by moving particle semi-implicit method”, Journal of Nuclear Science and Technology, vol. 49, no. 12, pp. 1156-1164, 2012.