河流会输运树枝、木材和人工废弃物——这种现象在洪水期间尤为显著。 当这些物体在桥梁、涵洞或进水口处堆积时,会限制水流,抬高上游水位,并加速冲刷和结构损坏。 拦截屏障能够拦截大块漂浮物,同时允许水和大多数沉积物通过。 通过控制物体的收集位置,它们可以保护关键基础设施,减少洪水带来风险和维护工作,并为清除物体提供安全的通道。 拦截屏障的性能依赖于间距、方向和水力条件,而仿真可以改善这些结构的设计过程。使用shonDy进行仿真,可以帮助工程师在不同洪水情境下量化力、回水上升、沉积和失败模式的表现,从而优化拦截屏障,使其能够 “拦需拦之物,通必通之质”。
案例说明
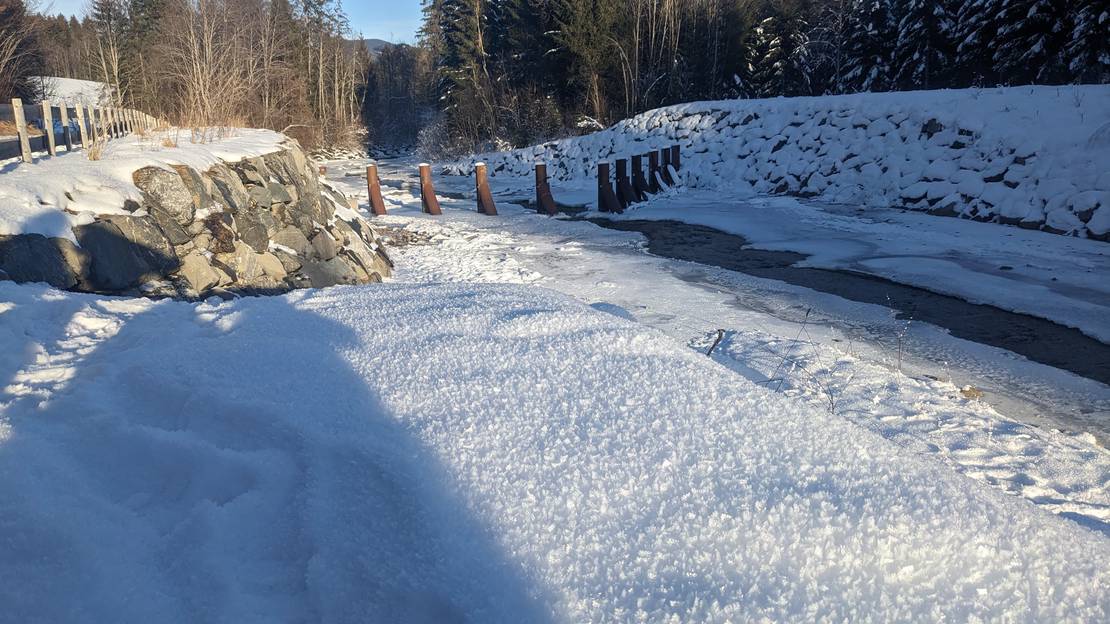
本次仿真场景大致基于下图所示的拦截屏障,该图由我们在德国的工程师拍摄,地点位于德国奥伯斯多夫附近。 该模型代表了一个长30米、横截面为梯形的河道。河道底宽11米,顶宽15米。 拦截屏障由垂直的桩组成,每根桩高4米,横截面为0.8米。 桩与桩的间距在1.7米到2.0米之间,既能拦截较大的物体,又允许水和沉积物通过。
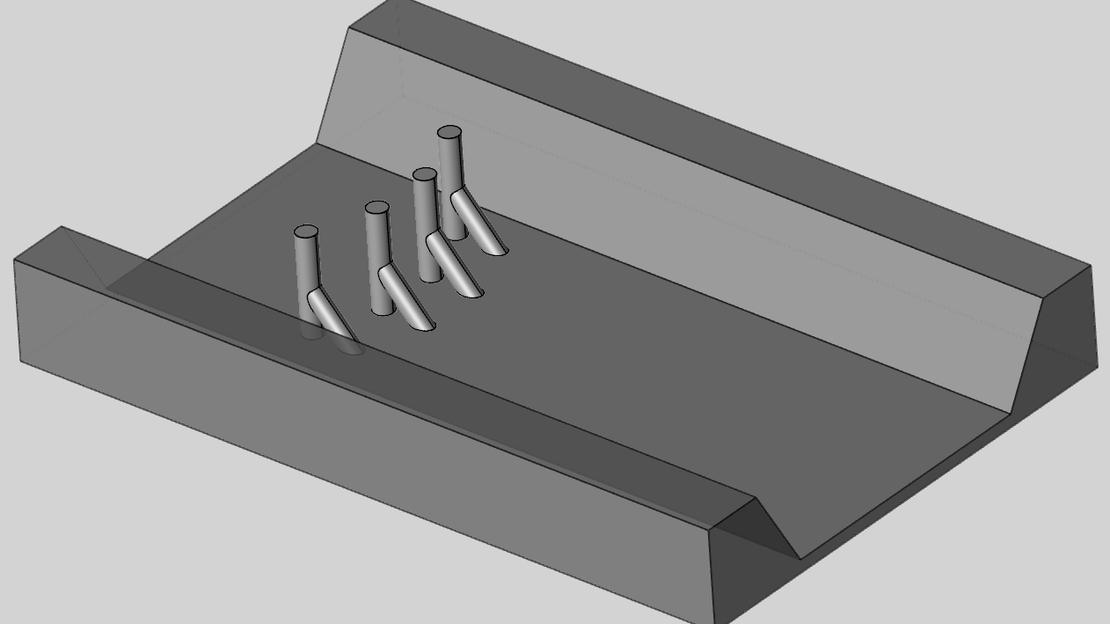
在仿真中,河道的流量约为49立方米每秒,相当于水深约2米,平均流速约为2米每秒。 评估中使用的物体为长2.1米、3米和6米的木材,每根木材的密度为700千克/立方米。 此配置用于评估水力性能、拦截效率以及在现实水流流量和物体负荷条件下的潜在回水效应。
仿真结果
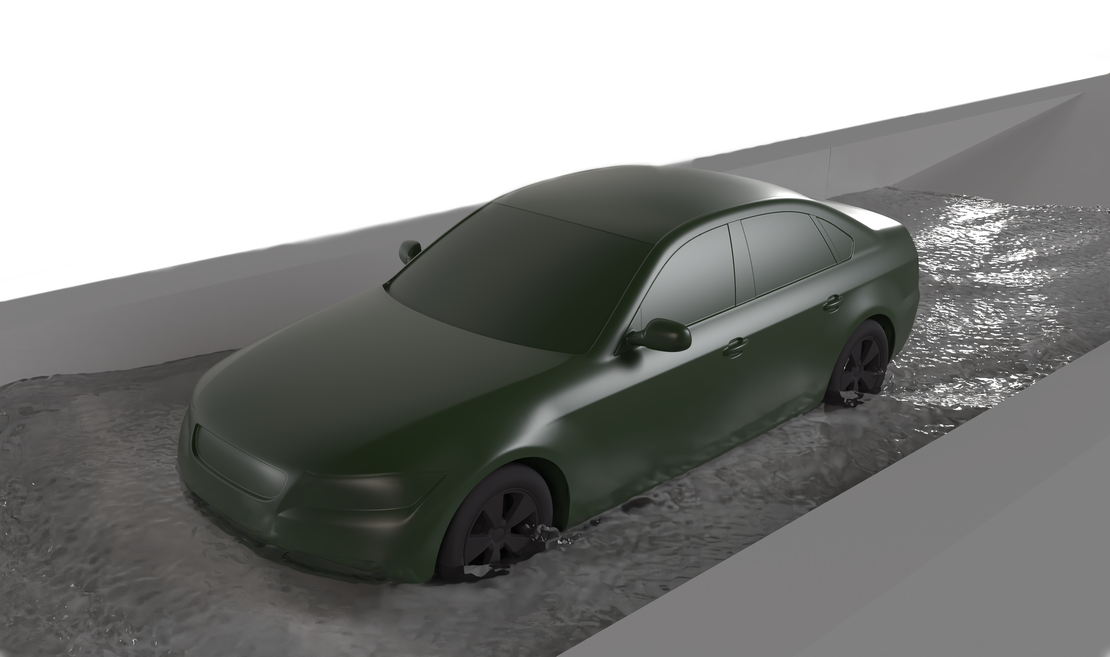
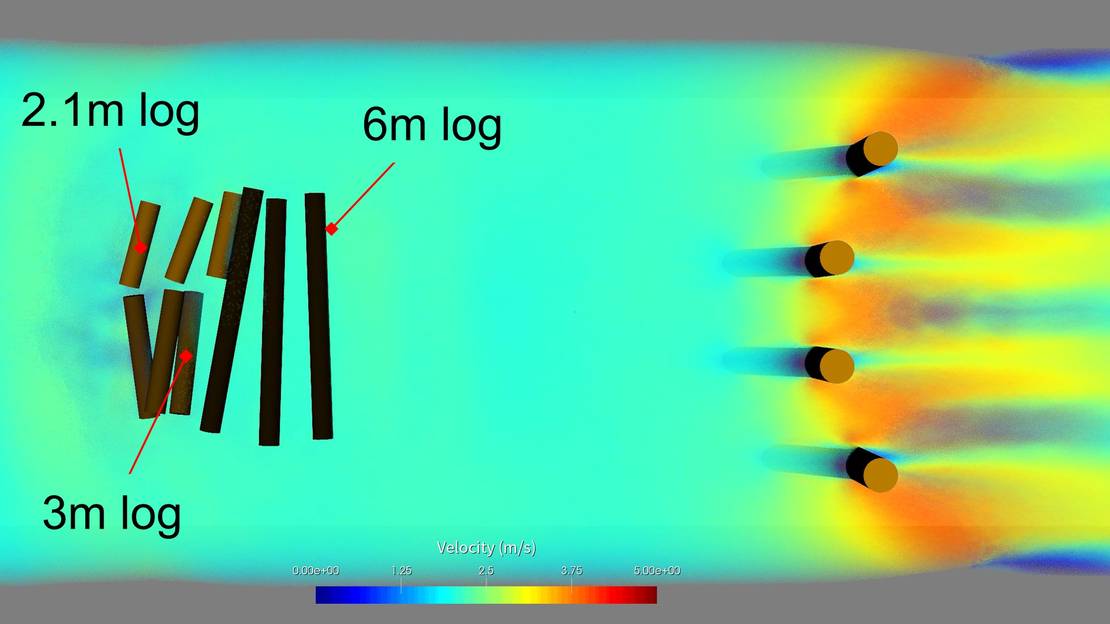
该案例的仿真结果将通过4个使用shonDy生成的视频进行展示,每个视频突出了仿真中的不同视角。 首先展示的是不同视图中的河道俯视图。工程视图里,可以非常清楚地观察到木材在水流中的运动。 渲染视图则展示了更具真实感的水流和堆积物的图像。
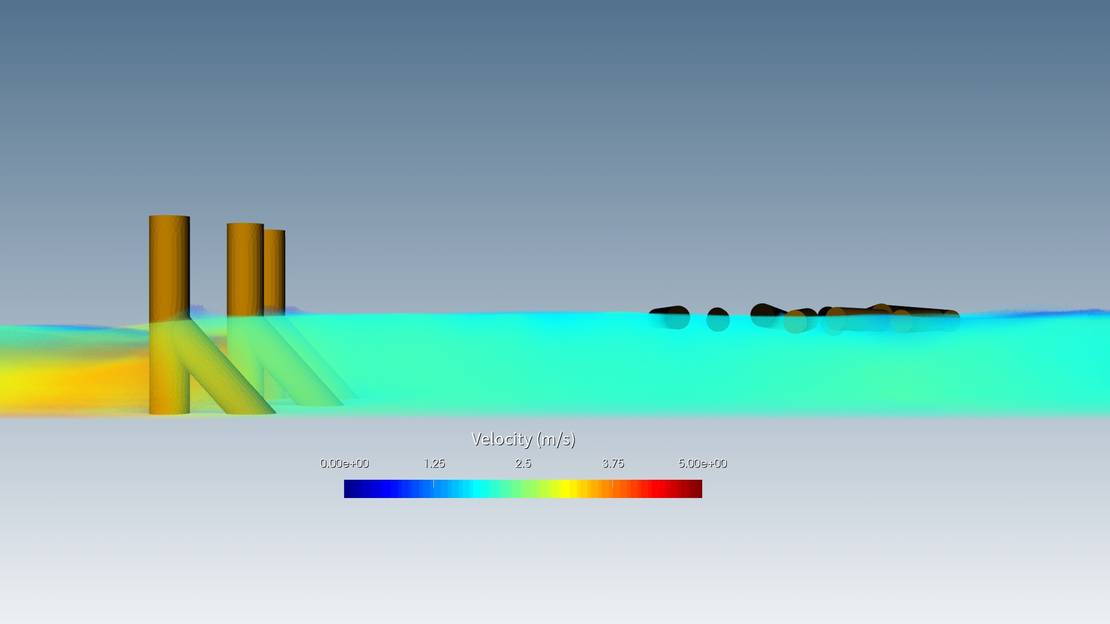
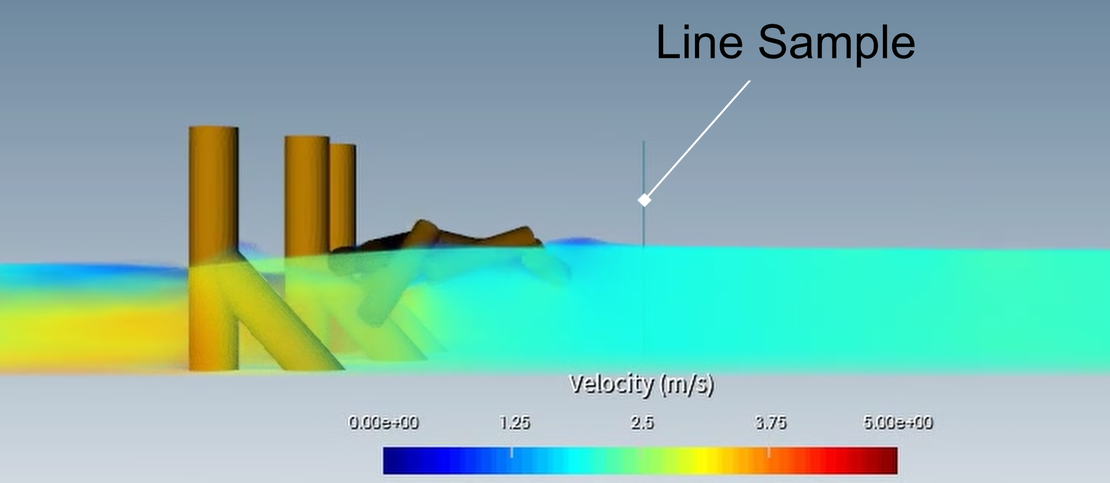
其次是不同视图下的河道侧视图视频,提供了关于流深、垂直物体运动以及拦截屏障交互的横截面视角。
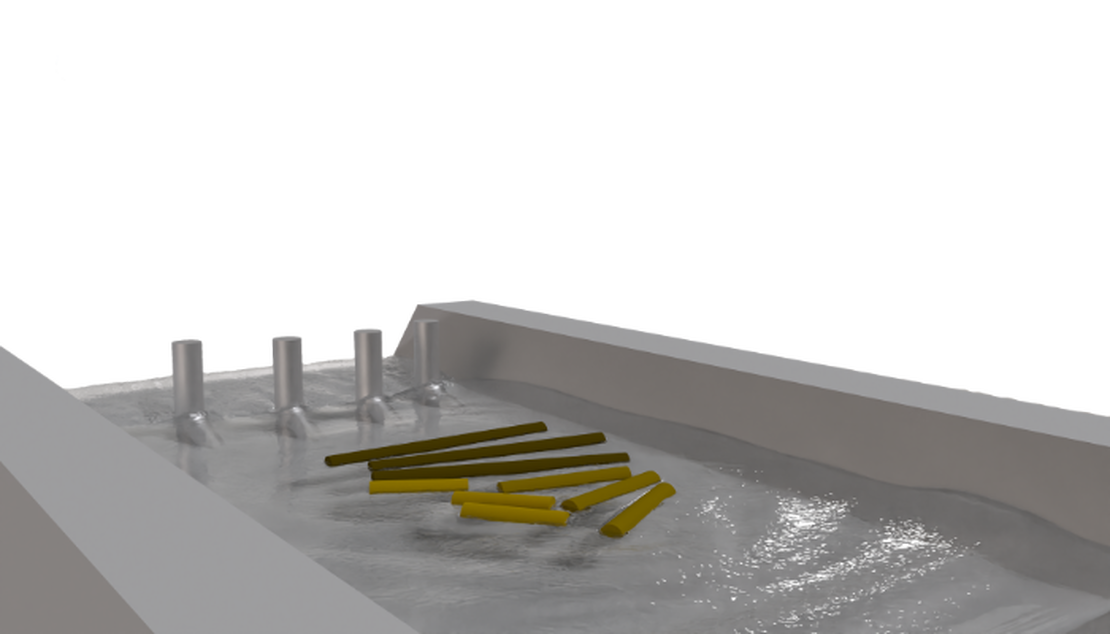
如上所示,仿真中使用了九根木材:三根6米长,三根3米长,三根2米长,最长的木材被安置在短木材的下游。 木材沿垂直于拦截屏障的方向移动,这种排列方式——结合垂直冲击与从大到小的排列顺序——旨在最大程度提高拦截屏障捕捉所有木材的可能性。
在第一次撞击时,所有三根6米长的木材被拦截,并最初将较小的木材挡住。 侧视图揭示了拦截屏障的对角线部分如何将所有木材推向水面。 然而,在初次碰撞后,较小的木材逐渐被水流推动向下。 它们一个接一个地被迫沉入大木材下方,并滑过拦截屏障。 这一结果表明,即便在优化堆积物保留的配置中,较小的木材仍然能够逃脱,并继续向下游移动。
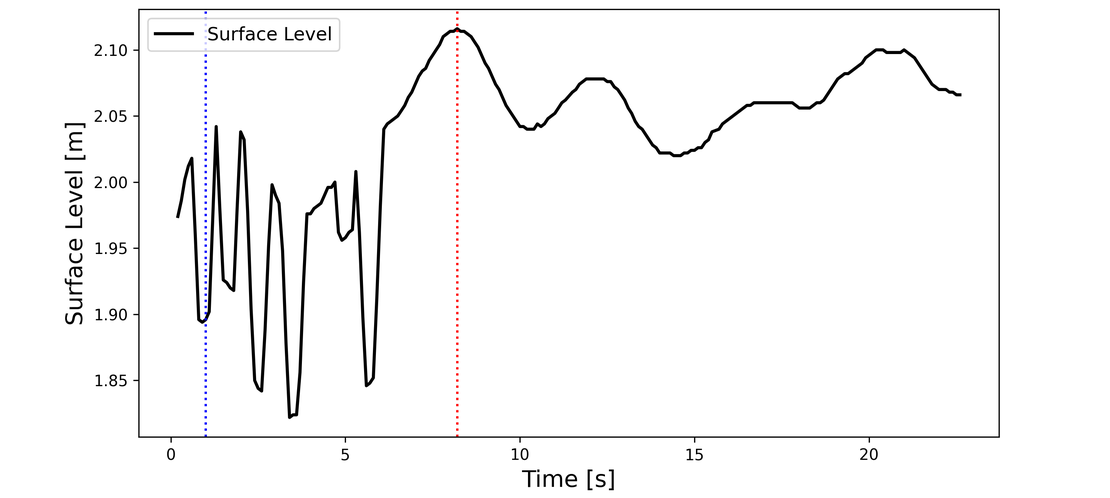
下图展示了在拦截屏障上游6米的采样线处记录的水面高度随时间变化的情况。 图中的尖峰(以垂直蓝线标记)对应的是个别木材通过采样线的时刻。 木材与拦截屏障碰撞后,水位显著上升,表明即使是在6米远的地方,也会迅速产生回水效应。 最大水位出现在大约8秒时(以红线标记),这与更多木材开始逃逸并减少临时堤坝效应的时刻相符。
最后这个视频提供了整个仿真的概览,结合了等轴视角和俯视图。 展现了水流、木材和拦截屏障交互的动态画面,既建立了清晰的技术认知,又以生动的视觉语言让结果一目了然。