罐内液体晃荡(Tank sloshing) 是指容器内液体因容器运动而产生的晃动现象。 这一现象在船舶和汽车等行业中十分常见,分别涉及船舶上的液化天然气(LNG)储罐和车辆中的燃油箱。 当液体在容器内移动时,晃荡会产生动态力作用于容器壁。
实验
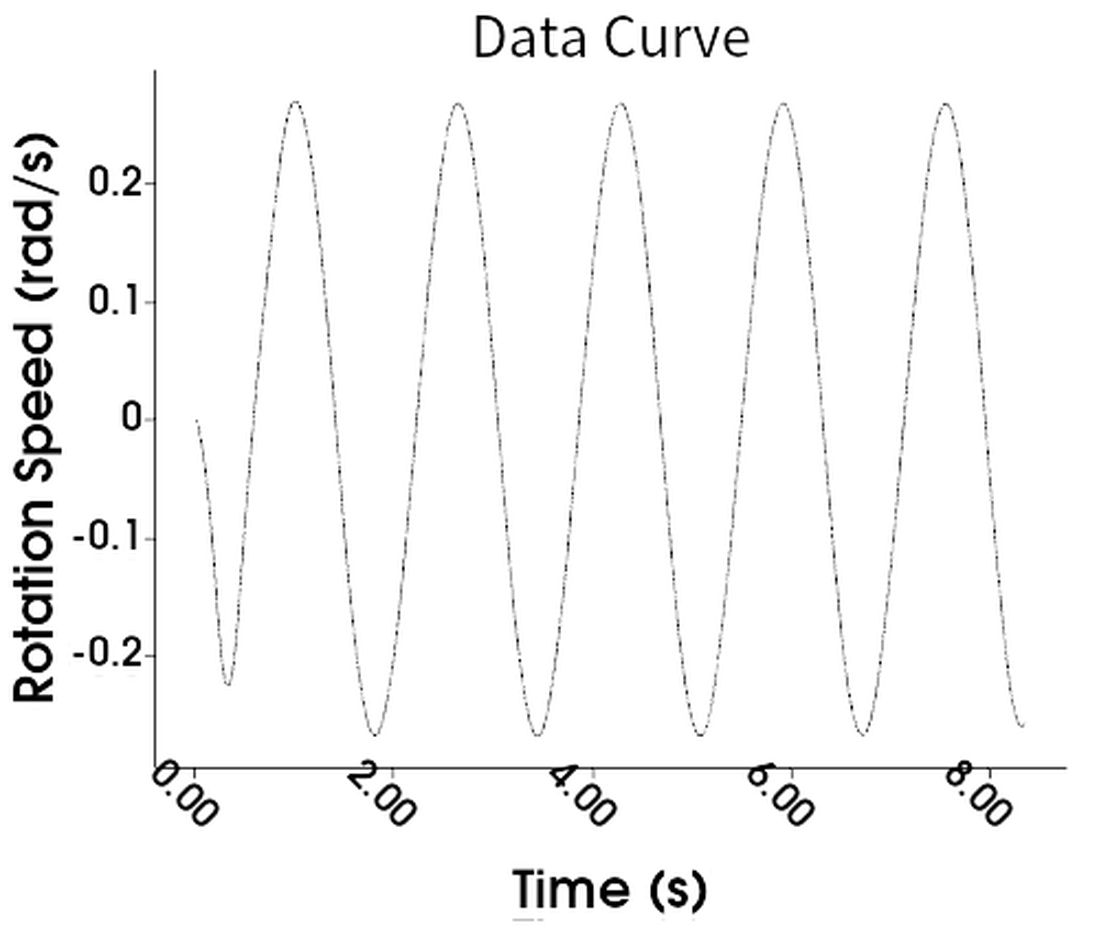
下图展示了几何布局。 如下图所示,水箱的尺寸为 0.9 x 0.508 米,旋转中心固定在 x = 0.45 米处,绕 Z 轴旋转。 在实验中,压力在6个位置进行采样,而在报告中,只使用1个传感器,其位置如图中绿点所示。 该图展示了随时间变化的角速度。 关于试验的详细描述,可查阅Delorme et al.。

模拟设置描述
建立了一个双向模拟模型。 流体区域使用等温流体进行模拟。 压力样品位于模拟域中,与实验中的传感器 1 位于同一位置。 该样品的压力读数稍后将用于比较模拟和实验获得的压力值。 初始液位高度为 93 mm。 粒子半径定义为 0.002 m,总共有 5175 个粒子。 重力作用在负 y 方向上,大小为 -9.8 m/s²。 下表详细介绍了仿真中使用的所有求解器控件。
| 参数 | 值 |
|---|---|
| 结束时间 | 8.3 秒 |
| 粒子半径 | 0.002 米 |
| 密度流体 | 998 kg/m3 |
| 运动粘度 | 0.896E-6 m2/s |
| 重力 | 9.81 m/s2 |
模拟结果与实验的比较
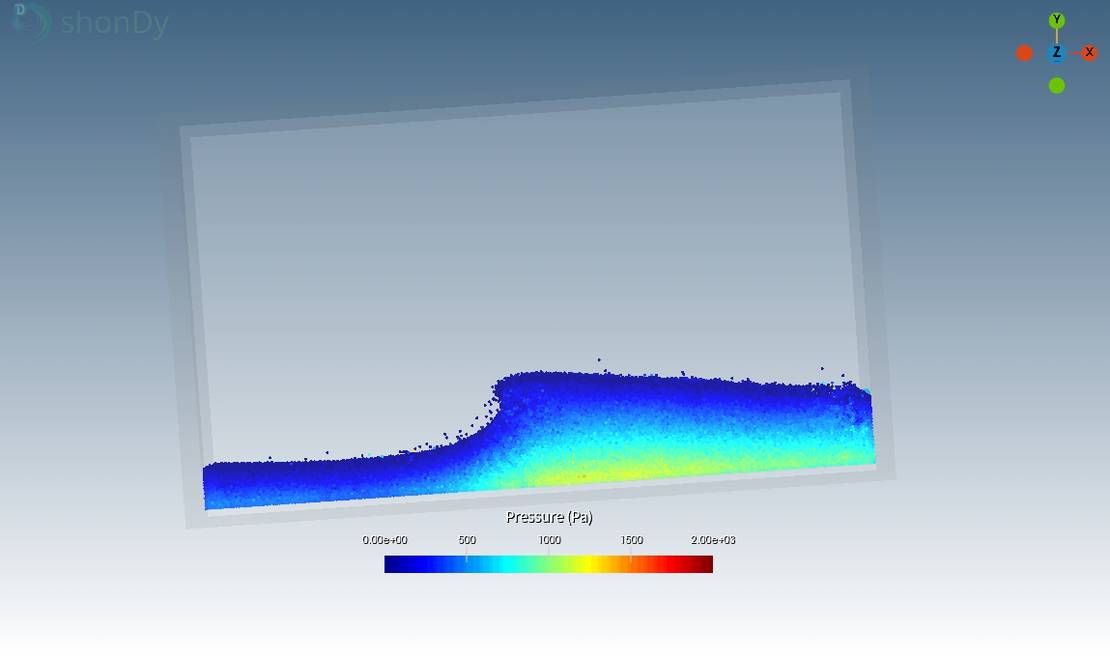
传感器1上的压力读数与实验中的模拟结果进行了比较。 下方视频初步呈现了压力分布情况,展示了罐体旋转过程中流体的运动状态。 压力是平滑分布的。 图中显示了Delorme 等人 实验得出的瞬态压力值与 shonDy 模拟结果的对比。 它显示了 5 次压力冲击,而其中 4 次的压力峰值又急又高。 模拟完美地捕捉到了压力上升的时刻。 然而,评估压力幅值具有一定挑战性。 压力峰值极为尖锐,无论是在模拟中还是在实验中都难以精确捕捉。 总体而言,仍可以认为压力峰值在定量上得到了较好的捕捉,其中第一个峰值略有低估,最后一个峰值略有高估。 此外,冲击发生后压力的发展过程也得到了很好的捕捉,无论是定量精度还是时间精度均表现良好。

