Introduction
A turbine vane is a stationary aerodynamic component located between the combustion chamber and the rotating turbine blades in a gas turbine engine. Its primary function is to guide the high‑temperature, high‑velocity gas flow from the combustor onto the downstream rotor blades at an optimal angle, thereby maximizing turbine efficiency and power output. Operating within the hottest zone of the engine, turbine vanes are continuously exposed to combustion gases, far above the melting point of their base alloys. To survive in this harsh environment, each vane integrates:
- Advanced materials, such as directionally solidified or single‑crystal superalloys.
- Protective coatings, including thermal barrier coatings (TBC) that shield against oxidation and radiation.
- Complex internal and external cooling passages, which channel relatively cool air from the compressor to maintain acceptable metal temperatures.
The turbine vane therefore sits at the intersection of aerodynamics, heat transfer, materials science, and structural mechanics. Its performance profoundly influences turbine efficiency, thermal reliability, and service life. Understanding and optimizing its thermal behavior is thus essential for modern high‑efficiency engine design.

Engineering Background
Turbine vanes work in one of the most extreme thermal environments within a gas turbine engine. The high‑temperature combustion gas continuously sweeps across the vane surface, while cooling air flows through intricate internal passages to prevent the metal from overheating. These seemingly opposite demands — retain strength under extreme heat and minimize cooling air usage — make the vane’s thermal behavior highly complex and tightly coupled.
Multiscale Thermal Challenges
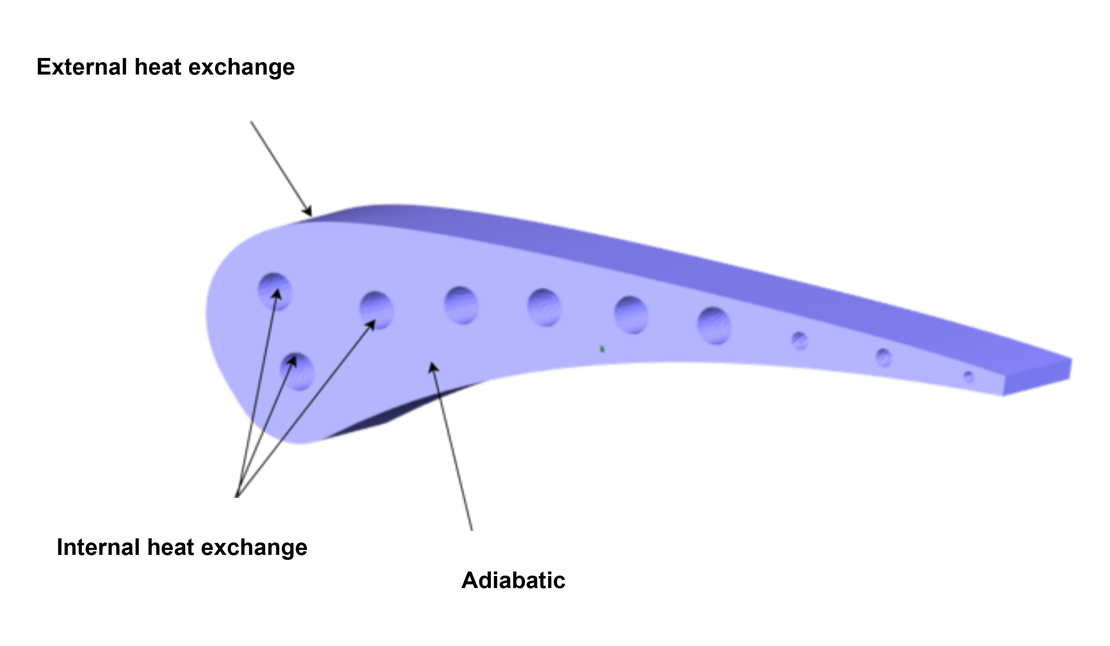
- External heating: The gas side is exposed to strong convective and radiative heat loads that vary sharply along the vane surface. Local peaks often occur near the leading edge, trailing edge, and tip, creating hot‑spot risks.
- Internal cooling: Inside the vane, air supplied from the compressor passes through serpentine and impingement passages. The flow distribution, pressure loss, and local heat‑transfer coefficients determine how effectively these regions are cooled.
- Through‑solid conduction: The metal walls conduct heat between these hot and cold sides, producing three‑dimensional gradients through the coating, substrate, and platform regions.
Engineering Impacts
If cooling is insufficient or uneven:
- Local metal temperatures may exceed design limits, leading to creep, coating spallation, and thermal fatigue.
- Excess cooling flow reduces engine thermal efficiency and may disturb combustor pressure balance.
- Large thermal gradients induce mechanical distortion and tip clearance variations, affecting aerodynamic performance and vibration safety.
Motivation for Advanced Thermal Evaluation
Traditional analytical methods or simplified correlations cannot capture these strongly coupled heat‑transfer mechanisms accurately. To ensure both reliability and efficiency, an advanced thermal analysis is required — one that accounts for realistic external heat loads, internal cooling performance, and solid conduction simultaneously.
Objectives
Building upon the background above, the goal of this study is to quantitatively evaluate the flow and thermal performance of a turbine vane under realistic operating conditions. The work focuses on the temperature distribution, thermal margins, and cooling efficiency of the vane, serving as a foundation for design validation and cooling optimization. Key Analysis Objectives are:
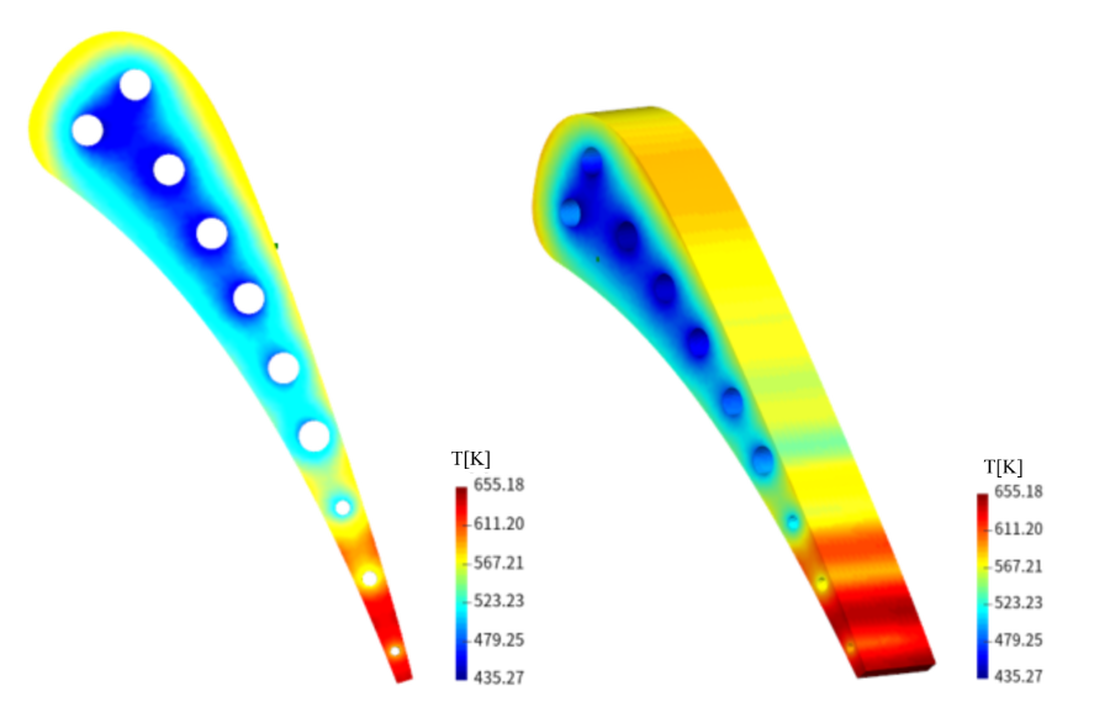
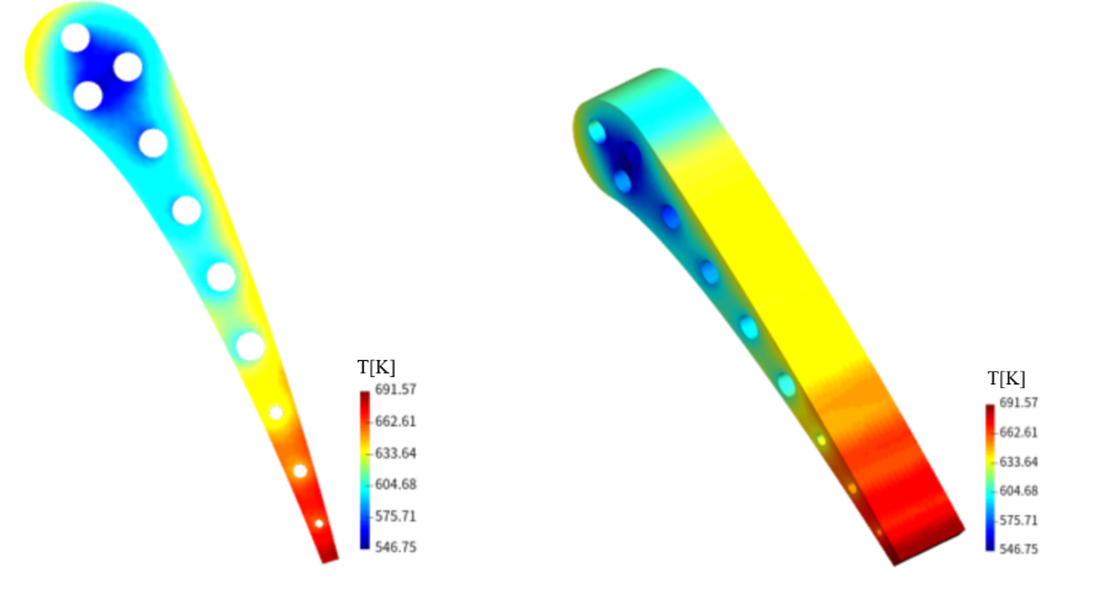
- Evaluate metal temperature fields: Determine steady‑state and transient temperature distributions across the vane, emphasizing critical regions such as the leading edge, trailing edge, tip, platform, and root.
- Identify thermal margins and hot spots: Locate and assess regions approaching material temperature limits or exhibiting large thermal gradients that may affect coating or structural integrity.
- Assess internal flow performance: Analyze internal cooling‑air distribution, pressure losses, and local convective heat‑transfer coefficients to understand cooling effectiveness and uniformity.
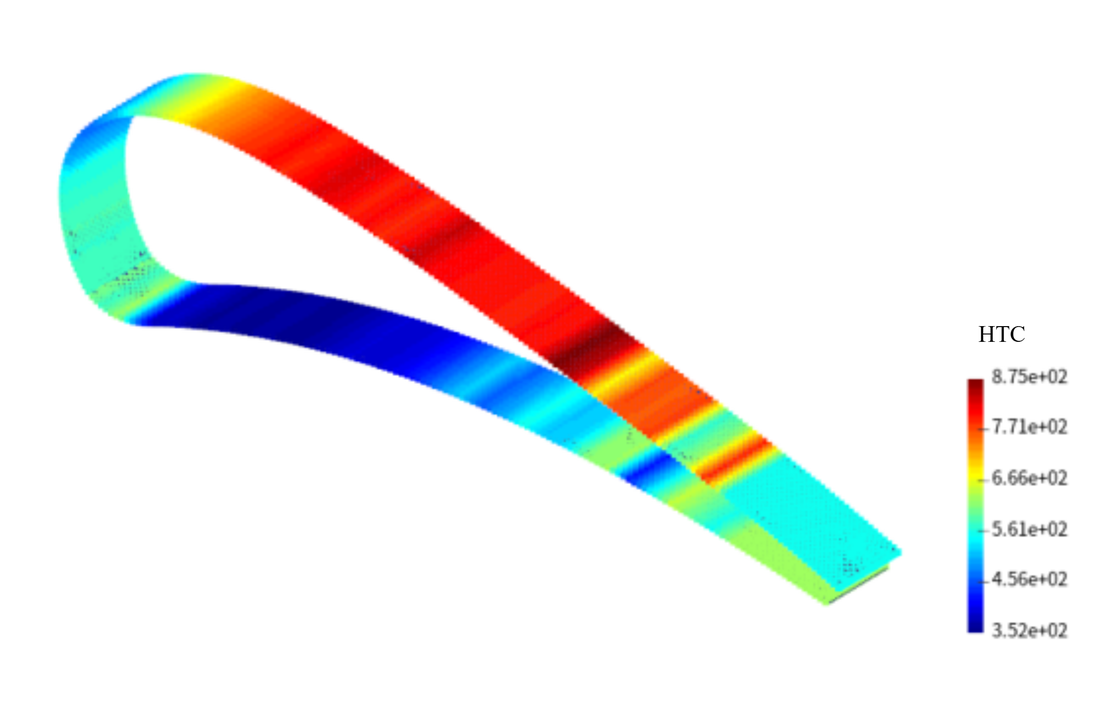
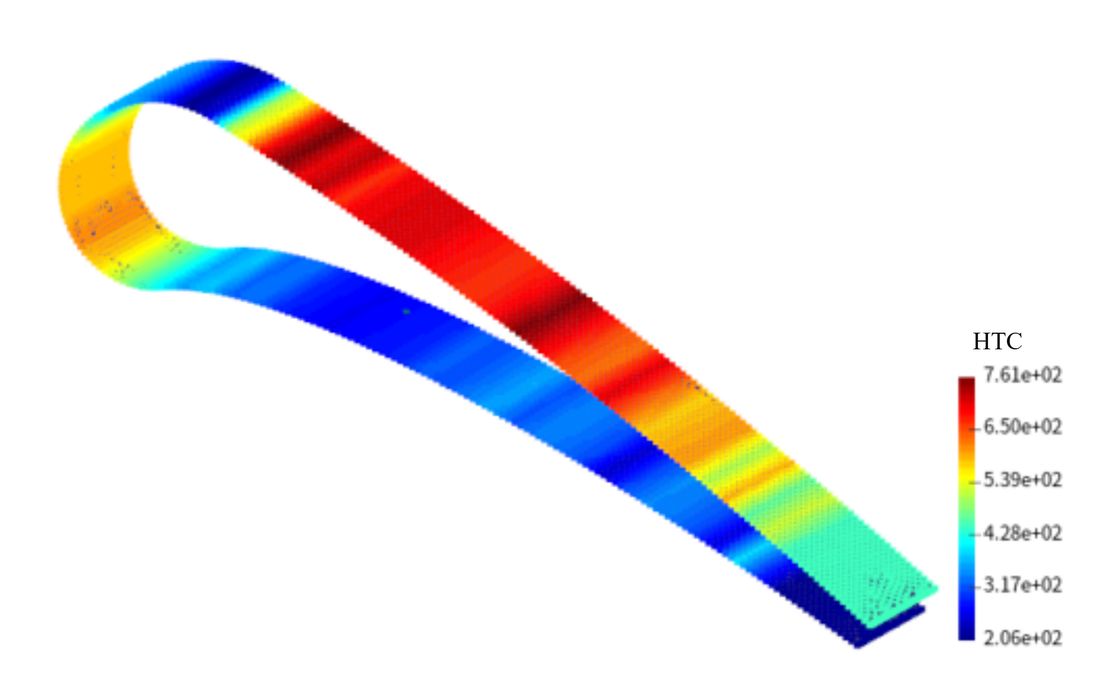
- Quantify external heating effects: Use reference gas‑side boundary data (HTC and effective gas temperature) to quantify the external heat load applied to the vane surface.
- Support cooling‑system optimization Provide data‑driven insight for layout adjustments — such as hole arrangement, channel sizing, and flow allocation — balancing metal temperature reduction and cooling‑air consumption.
Solutions
The thermal analysis of a turbine vane involves three tightly linked physical domains: the external hot‑gas flow, the internal coolant flow, and the solid metal conduction between them.
Current Solutions
- Separated, Step‑by‑Step Simulation: The most widely used approach divides the system into individual analyses:
- The external gas flow is modeled by 3D CFD to obtain heat‑transfer coefficients (HTC) and reference gas temperatures.
- The internal cooling circuit is analyzed separately, often with 1D or simplified flow models to calculate coolant mass flow, pressure loss, and internal HTC.
- These results are then used as boundary inputs for a standalone 3D solid heat‑conduction simulation to predict the metal temperature field.
- Fully Coupled CFD–CHT Simulation: Another approach treats the entire configuration—gas domain, solid domain, and cooling passages—as one integrated CFD model. This Conjugate Heat‑Transfer (CHT) method directly captures interactions among the external flow, coolant flow, and metal temperature.
Challenges of both Approaches
Although these methods are well‑established, they each have notable drawbacks:
- The step‑by‑step method requires multiple data transfers between tools, making it slow and difficult to automate.
- The full CFD–CHT method delivers the highest fidelity but demands enormous computational resources and setup effort, making it inefficient for design iterations or optimization cycles.
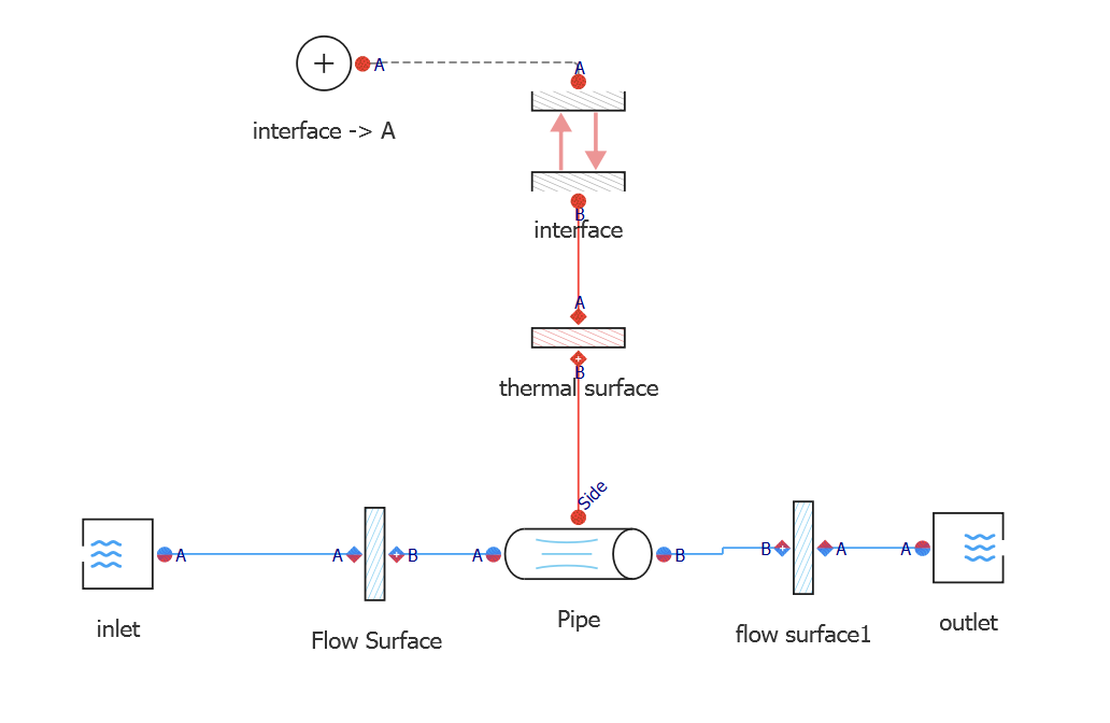
Our Approach — 1D/3D Coupled Thermal Simulation
To overcome these drawbacks, we employ shonTA, a simulation software that seamlessly integrates network‑based 1D analysis with 3D finite‑element thermal computation. shonTA enables hybrid modeling of cooling networks and solid domains within one environment, simplifying existing workflows and significantly accelerating iteration.
Key Capabilities:
- Hybrid 1D/3D computation: Combines a fast internal flow network solver with detailed 3D finite‑element thermal analysis to capture both local and global temperature characteristics accurately.
- External CFD data integration: Supports direct import of HTC and reference temperature distributions from external CFD calculations as boundary conditions.
- Multi-objective Optimization: Supports multi‑objective optimization for cooling layout, flow allocation, accelerating design improvement.
With shonTA, the formerly disconnected analyses are unified into a simpler and more effective workflow. It delivers accuracy close to full CFD‑CHT simulation while maintaining the efficiency of simplified network methods — enabling rapid evaluation and optimization of turbine‑vane cooling performance.
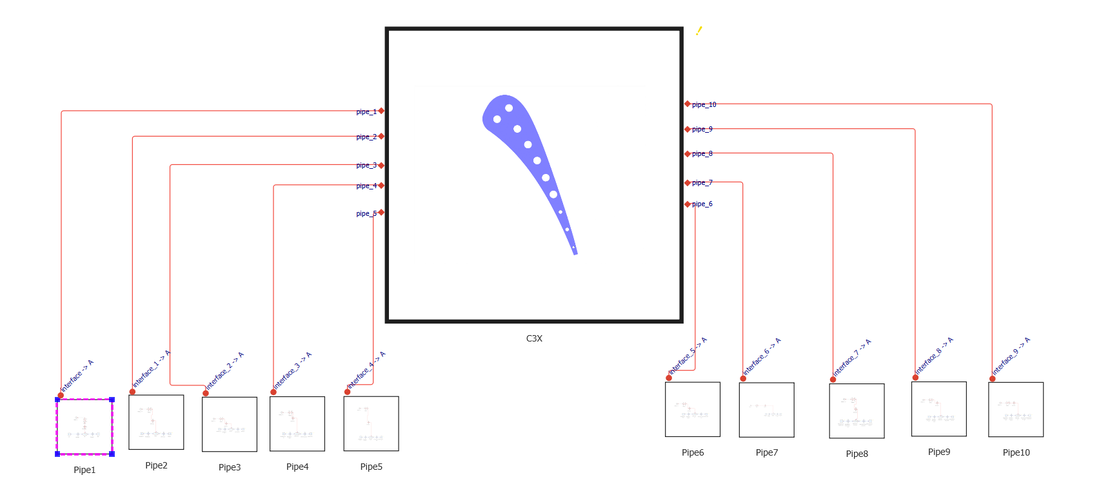
Case Setup: C3X & MARKⅡ Turbine Vane Study
The case operating condition data originates from the results of the 107th run of the C3X and 16th run of the MARKⅡ as documented in Reference [1]. The geometric parameters of the case model likewise derive from the data recorded in Reference [1]. One approach involves coupled 1D/3D simulation, wherein the HTC data for the cooling pipes and the in-pipe temperatures are obtained from the one-dimensional simulation.
Geometry


Pre-processing
The HTC data for the airfoil surface is sourced from Reference [1]. The three-dimensional thermal simulation HTC for the pipe heat dissipation is likewise derived from this reference. Owing to the discrete nature of the data points, HTC values for regions without recorded data were determined via linear interpolation.
Results and Validation
Temperature results
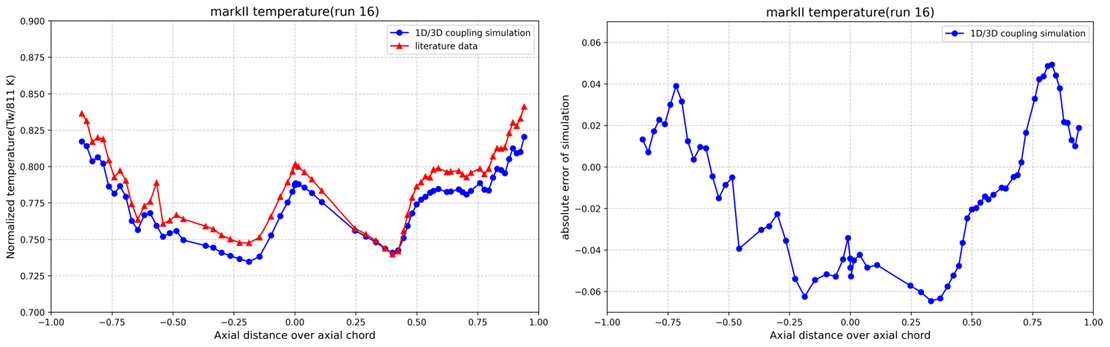
Temperature sampling results on the front and rear surfaces, alongside literature comparisons, are presented below. The left panel displays normalised temperature comparisons, while the right panel shows absolute error comparisons. The absolute error range falls between [-0.066, 0.053].

For internal flow, the simulation, experimental results, and associated errors are presented in the table below. Both the relative errors in the Reynolds number and the mean temperature are less than 2%.
C3X
| Position | Re(exp) | Re(sim) | Error(%) | AvgTemp(exp)/K | AvgTemp(sim)/K | Error(%) |
|---|---|---|---|---|---|---|
| pip_1 | 222280 | 223763 | 0.67 | 348.83 | 348.33 | 0.14 |
| pip_2 | 233690 | 238150 | 1.91 | 345.32 | 341.23 | 1.2 |
| pip_3 | 227920 | 228219 | 0.13 | 339.49 | 339.14 | 0.1 |
| pip_4 | 240680 | 241789 | 0.46 | 342.3 | 341.9 | 0.12 |
| pip_5 | 241440 | 242268 | 0.34 | 333.99 | 333.35 | 0.19 |
| pip_6 | 229080 | 229739 | 0.29 | 364.95 | 364.24 | 0.19 |
| pip_7 | 229540 | 230608 | 0.47 | 343.37 | 342.37 | 0.29 |
| pip_8 | 152600 | 154688 | 1.37 | 365.41 | 362.55 | 0.79 |
| pip_9 | 87920 | 88841 | 1.05 | 408.78 | 405.63 | 0.78 |
| pip_10 | 65500 | 65808 | 0.47 | 453.18 | 448.69 | 1 |
MARK II
| Position | Re(exp) | Re(sim) | Error(%) | AvgTemp(exp)/K | AvgTemp(sim)/K | Error(%) |
|---|---|---|---|---|---|---|
| pip_1 | 42490 | 41955 | 1.26 | 396.65 | 397.35 | 0.18 |
| pip_2 | 44910 | 44904 | 0.01 | 376.82 | 377.61 | 0.21 |
| pip_3 | 43350 | 43303 | 0.11 | 389.03 | 389.7 | 0.17 |
| pip_4 | 45910 | 45810 | 0.22 | 404.06 | 404.59 | 0.13 |
| pip_5 | 45100 | 45183 | 0.18 | 358.74 | 359.18 | 0.12 |
| pip_6 | 44000 | 44075 | 0.17 | 351.02 | 351.37 | 0.1 |
| pip_7 | 40550 | 40588 | 0.09 | 368.07 | 368.17 | 0.03 |
| pip_8 | 28080 | 28352 | 0.97 | 416.48 | 416.05 | 0.1 |
| pip_9 | 16690 | 16824 | 0.8 | 446.9 | 446.98 | 0.02 |
| pip_10 | 15750 | 15872 | 0.77 | 480.14 | 472.6 | 1.6 |
Summary and Conclusions
This study established a practical and accurate framework for turbine‑vane thermal analysis. To overcome the limitations of conventional approaches, the shonTA platform was employed to perform coupled one‑dimensional and three‑dimensional thermal simulations of turbine vanes. shonTA supports external HTC data import, hybrid 1D/3D modeling, and a unified workflow that streamlines simulation setup and significantly accelerates design iterations. Validation using C3X and MARK Ⅱ benchmark cases demonstrated excellent agreement with experimental data. The absolute surface‑temperature deviation remained within ±0.07 of normalized reference values, and predicted internal‑flow and outlet temperatures exhibited less than 2 % relative error compared with measurements. These results confirm the high reliability and predictive accuracy of the shonTA platform under representative turbine‑vane conditions. In summary, shonTA’s 1D/3D coupled method delivers high fidelity with greatly reduced computation time, providing an efficient and robust tool for turbine‑vane cooling analysis and optimization.
References
[1] L. D. Hylton, M. S. Mihelc, E. R. Turner, D. A. Nealy, and R. E. York, “Analytical and Experimental Evaluation of the Heat Transfer Distribution over the Surfaces of Turbine Vanes,” NASA CR-168015, May 1983.